Align Community Performance Data With Your Strategic Initiatives
Envisio customers can now unlock the power of Polco Track, a comprehensive database of performance measures, benchmarking data, domain scores, and KPIs purpose-built for local governments.
Constructed from verified sources and analyzed by data scientists and academic experts, Polco Track provides local governments with community-specific performance measures, benchmarks, and scores in ten domains of community livability. These ready-to-use KPIs can be embedded directly into Envisio plans, public dashboards, and reports to save you time on data collection, analysis, and reporting.
Pre-built library of local government measures
Livability scores in ten livability domains
Embed directly into Envisio plans, reports, dashboards
Benchmark regionally, nationally, or against a cohort
Discover the Power of Envisio and Polco Track
The leading strategy and performance management platform meets the richest set of government performance indicators available today.
Align Strategy With Performance
Easily align your community data with your strategic priorities and use it to guide decisions, track performance, and share progress.
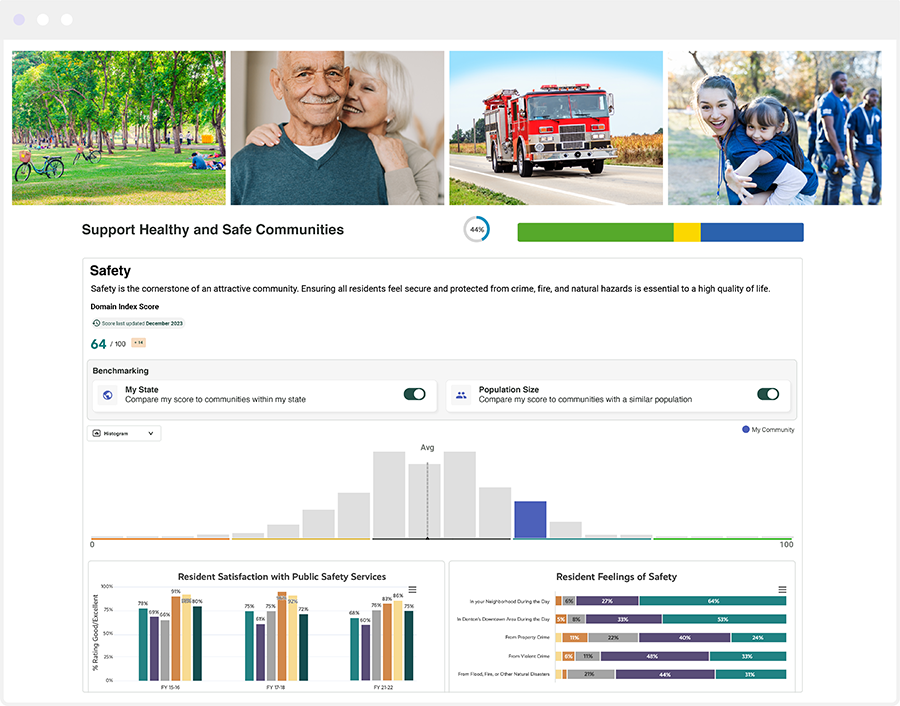
Visualize Performance
Measure performance changes over time and easily identify if you’re on the right track. If not? Quickly identify problems and adjust accordingly.
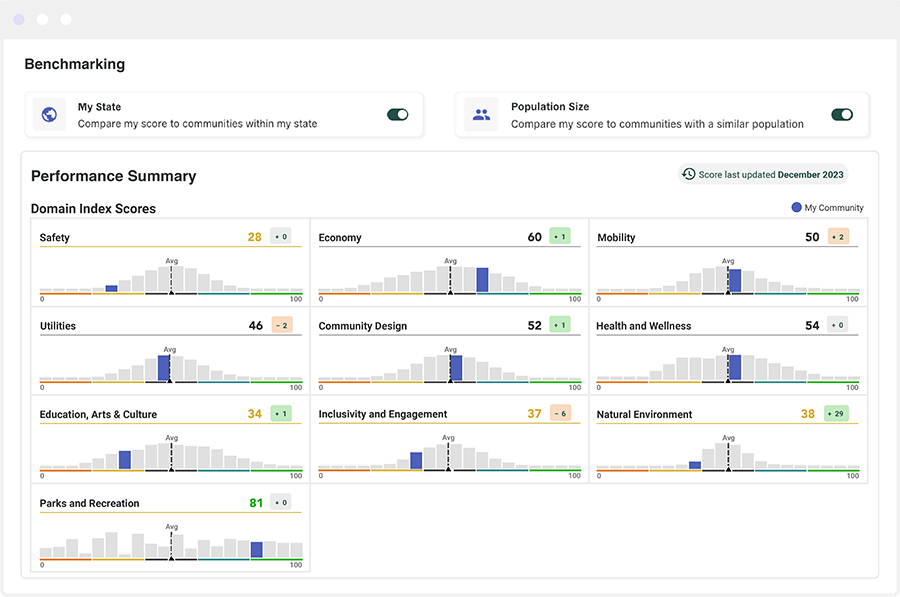
Benchmark Progress
Use Polco Track and Envisio to compare your organization’s performance to both regional and national benchmarks, or build a custom cohort of peer communities.
Embed Visualizations
Embedded visualizations in Envisio are dynamic. Measures will auto-update within Envisio when new GPAL data is added.
Turn Data Into Action
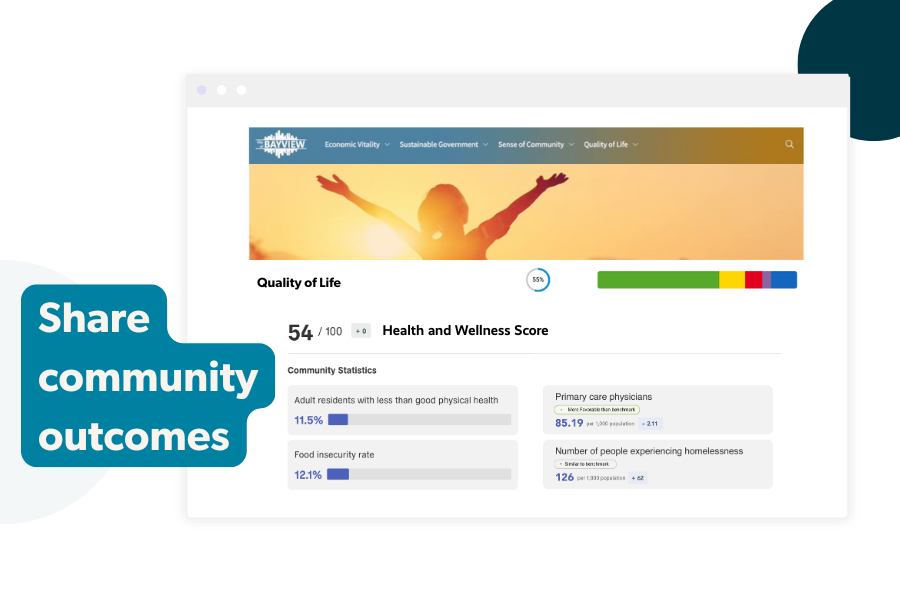
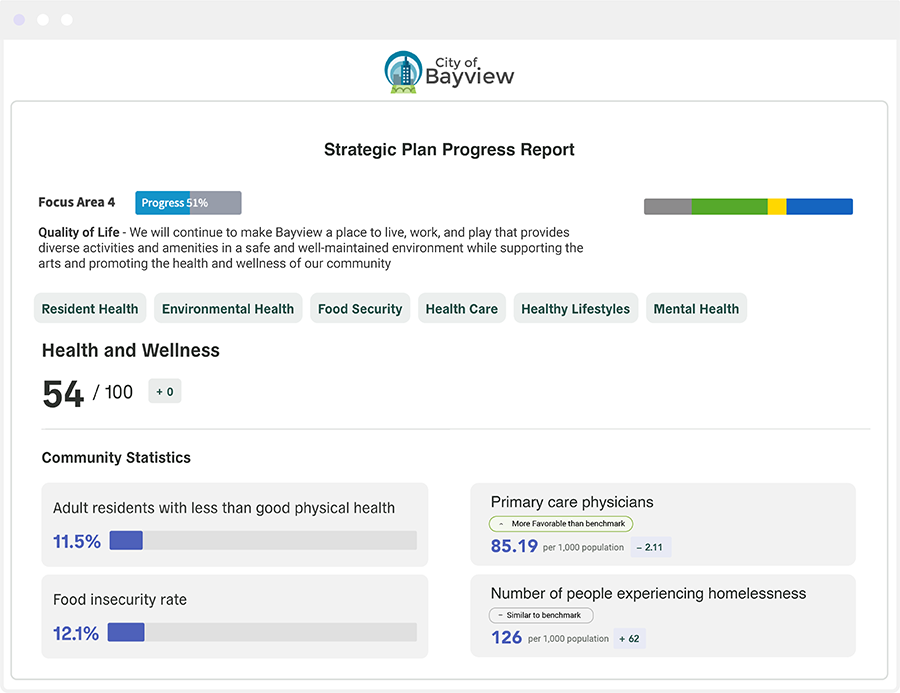
Each of the 10 livability domains comes with a data-science-backed score for your community. Use these scores to benchmark, guide action planning, and understand impact.
Build Trust and Transparency
Just a few clicks allow you to align your community performance data with the strategic priorities in your Envisio plan. Share results with residents, elected officials, and staff using Envisio’s public dashboards and reports.
Polco Track By The Numbers
Polco’s data science experts collected and filtered down hundreds of public datasets from trustworthy sources like the US Census and National Community Surveys into meaningful quality-of-life indicators and benchmarks.
0
livability domains.
0
public datasets.
0
academic partners.
0
geographic entities.
Integration Gallery
Browse our integration gallery and get inspired to can incorporate ready-made performance measures for your community into your plans, reports, and public dashboards.
Join the Community
Join us in shaping the future of governance with Envisio and Polco Track. Hear from other public sector trailblazers.
-

“We are excited to help optimize the government’s data-informed decision making processes, and ultimately maximize constituent quality of life.”
Nick Mastronardi
CEO, Polco
-
“We want department heads and leadership teams to have, at their fingertips, this performance tool. And that’s always been something that Ontario has wanted to do, and now with Envisio we can do it.”
Jordan Villwock
Deputy City Manger, City of Ontario, CA

Ready to Get Started?
This powerful integration provides a complete solution for local governments looking to implement data-driven plans, manage performance, and report impact to their communities. Let’s talk.
Get Started