Plans
Everything you need to deliver your plans, manage strategy and report progress.
- Customizable plan structure
- Automated and on-demand progress reports
- Save time with AI features
Everything you need to deliver your plans, manage strategy and report progress.
Centralize, analyze and visualize your performance data. Align performance measures with plans.
Manage, deliver, and communicate projects. Align projects with plans for end-to-end visibility and reporting.
Share your strategy story with external stakeholders via customizable public dashboards.
Update your data as often as you want. Set the schedule, then let your data upload automatically.
All the chart types you need. Charts are interactive and can be customized with your own colors.
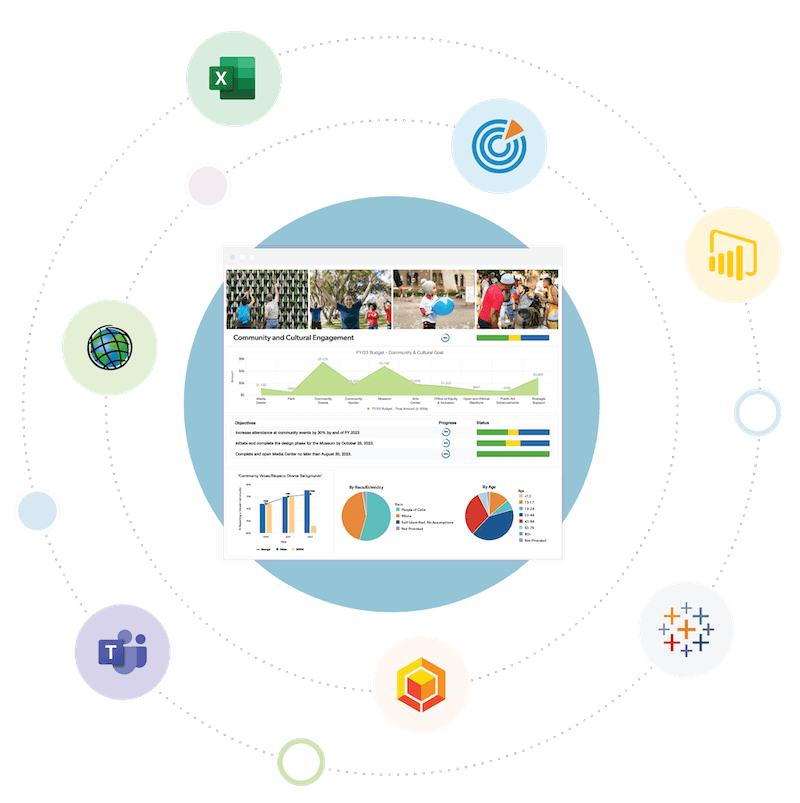
Quickly create compelling dashboards by dragging, dropping and resizing individual charts.
Build scorecards with traffic light indicators for a fast overview of performance.
Add comments to charts and individual data points to provide context for readers.
Slice, dice and drill into your data to discover new trends and insights.
Publish dashboards to a shareable URL so anyone can access them.
Attach charts and graphs to the goals, strategies and actions in your plans.
Include performance measure visuals in your plan’s progress reports.
Education: School District Student Success Dashboard/Scorecard
VIEW DASHBOARDLocal Government: Economic Development Community Dashboard
VIEW DASHBOARD


"“Our entire report that goes to the Board of Trustees is generated in Envisio. All of the metrics related to our strategic plan live in Envisio, and we have assigned the ownership and agency of those data points to certain people. It’s helped us develop a common lexicon, and it is the tool in which we demonstrate our progress. Oftentimes, the focus of it is really to celebrate all of the people who contribute to our strategic plan.""