
Local governments have a lot to juggle when they undertake any infrastructure upgrade or new project. From new roads to upgrading utilities, adding parks and stormwater systems, and bond-funded construction, every one of those projects needs to be tracked, managed, and communicated to (at least!) two very different audiences:
- First, the council members responsible for fiscal oversight.
- Second, the residents are staring at the giant, expensive project, scratching their heads, and wondering what it’s all about and who benefits.
Good infrastructure project management and clear progress reports become critical, quickly.
Something we often see when local government organizations first come to us is that staff are painstakingly pulling together disparate project updates from multiple departments. They generally have to assemble council packets manually, and publishing public-facing updates is a time consuming process – if it happens at all.
By the time a report reaches council, the data might already be a few weeks old.
And by the time a public-facing update is delivered, the ability to control the narrative around a project has long since slipped away.
Getting it right takes the right information, the right format, and the right software. This post covers all three, and gives you the best practices from real local governments who are excelling at exactly this.
Reporting to Council: What Do They Want to Know?
Council members are responsible for fiscal oversight and overall strategic direction. They need to know whether capital projects are performing as expected throughout the project cycle; from budget approval to final delivery.
A solid council report on infrastructure and capital improvement projects covers:
- All active capital projects: Current status (e.g. in progress, on hold, complete)
- Budget vs. actual spending: How much was approved, how much has been spent, and whether there are variances worth flagging
- Timeline performance: original completion date versus current projected completion
- Issues or risks that require elected officials’ attention or a decision
- Strategic alignment: how each project connects to other adopted plans, long-range capital programs, or community priorities
The most common gap in council reporting is timeliness. Many organizations produce quarterly updates, but questions from elected officials come up monthly, or weekly. Using a software platform like Envisio for tracking public works assets and generating council reports can make this process easy, because updates and reports can be pulled on demand.
Reporting to the Public: What Do Residents Want to Know?
Public-facing infrastructure project reporting has a different job.
Many infrastructure projects, particularly ones that require construction in urban areas, involve noise pollution, traffic disruption, changes to the local ecosystem, and more. Infrastructure projects and decisions impact people’s lives and livelihood, so building trust and transparency into this process is critical.
Residents want to understand what’s happening in their community and when it will affect them.
Line-item budget tables and procurement timelines are tools for internal staff. The public wants the headline: what’s being built, where, how, why, what it costs, and when it’ll be done.
For public reporting on capital projects and infrastructure, the most useful elements are:
- Plain-language project descriptions: What is this project and why is it happening?
- Status indicators: Simple “in progress” or “complete” label goes a long way to help residents quickly filter through a large number of projects.
- Timelines: When did the project start and when will it be done?
- Maps: Where exactly is this happening?
- Budget summaries: How much does this cost? Where is the money coming from? Is the project within budget?
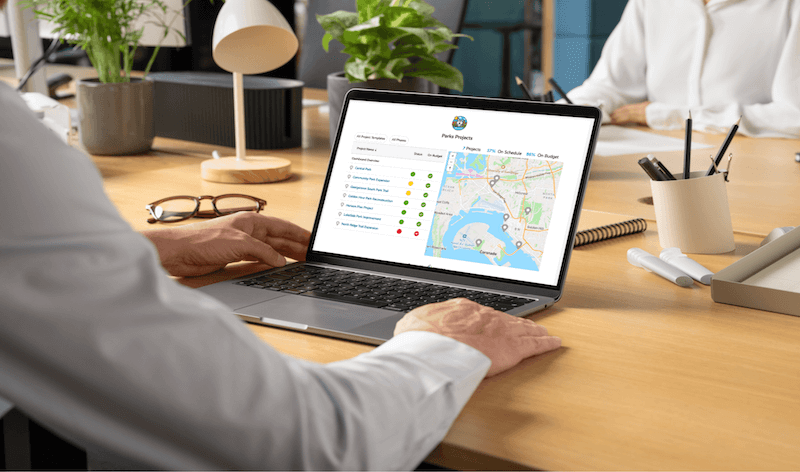
Interactive capital improvement public dashboards are an excellent format for this kind of reporting: Accessible from any browser, and available to anyone in the community. There’s a practical bonus too: residents who can look up project status online skip the phone call. Fewer “what’s happening with that road?” questions for staff (and maybe council!)
>Take the Interactive Capital Improvement Dashboard tour!
What to Include in a Capital Infrastructure Project Report
Whether you’re preparing a council packet or publishing a public dashboard, these elements should appear in every capital projects and infrastructure update:
- Project status: Use a consistent, color-coded system (not started / in progress / complete / on hold) and apply it the same way across all projects so it’s easy to scan.
- Budget tracking: Approved budget, amount committed, and amount spent. Flag variances with a brief explanation.
- Timeline and milestones: Key phases, original projected completion, and revised projected completion if the schedule has changed.
- Project description: A two- or three-sentence plain-language summary of the project and its purpose. This is especially important for public-facing reporting. Capture the “why”.
- Location: An interactive map showing where each project is happening can be very powerful. Residents connect with projects when they can see them geographically.
- Strategic connection: Council wants to see how capital work connects to the strategic priorities they’ve adopted. Linking projects to your strategic plan (where appropriate) or long-range goals makes it easier to demonstrate that infrastructure spending is intentional—and gives residents the same line of sight.
4 Real Examples of Infrastructure Project Reporting
Here’s what good infrastructure reporting looks like when it’s actually working, from four real local governments.
1. City of Cedar Park, TX: Capital Projects Dashboard
Cedar Park is the most instructive example on this list, because you can see the full before-and-after.
Before the dashboard, project updates lived in a large spreadsheet managed across multiple departments. Project managers submitted updates in engineering language, which then went to the communications team to rewrite for public consumption. By the time that process ran its course, the information was often three to four months old and already stale before it hit the website.
Today, Cedar Park tracks 90 capital improvement projects on a single public dashboard embedded in the city website. 98% are on schedule and 100% are on budget. Project managers update directly to the platform, cutting the approval chain that was slowing everything down. AI tools built into the platform translate technical project updates into plain-language summaries automatically: one update, ready for the public.
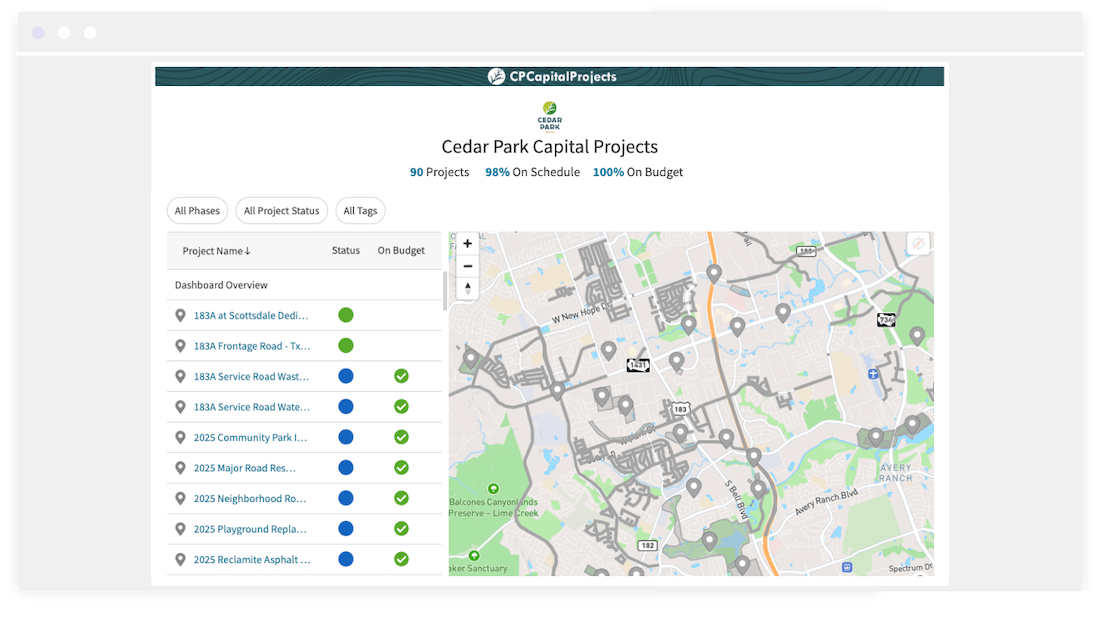
A few things make Cedar Park’s approach worth studying:
QR codes on project signs. Physical construction signs around the city include a QR code that links directly to that project’s page in the dashboard. Residents can pull up the full project detail right at the work site.
Honest status reporting. Cedar Park puts disruptions on the public dashboard alongside progress updates. Their regional trail connection — a $10 to $12 million project — hit permitting delays with a state agency, and that showed up on the dashboard. The Recreate project, a conversion of an old library into a parks programming space, ran into moisture remediation issues that pushed the timeline. Both were flagged as disruptions in real time. The reasoning: if the dashboard always shows everything on track, it loses credibility. And when future bond funding comes up, council and residents are more likely to trust an organization that was honest with them when things went sideways.
Strategic plan linkage. Each capital project connects to Cedar Park’s six strategic goals. The Recreate project, for example, links directly to the city’s livability goal and its redevelopment strategy. Council and the public can see how a construction project ties to the community’s broader direction.
Top Tip
Build into the regular rhythm. Cedar Park runs on quarterly project updates as a baseline, but some project managers update monthly when a project hits a notable milestone. Their dashboard also feeds directly into the city manager’s annual evaluation. At that point, the reporting is already done.
2. Commerce City, CO: Parks and Recreation
Commerce City’s public dashboard tracks progress on its Parks, Recreation & Golf Master Plan — a 5-to-10-year roadmap built with direct input from residents through community visioning workshops. Recreation really matters to their city, which makes sense: it’s one of their biggest assets! With over 800 acres of park space, hundreds of trails, Paradice Water Island Park, mountains, recreation centres, volleyball parks, barbeque pits, and more, they prove to their community that “play” goes way beyond just a nice thing to have. It’s essential.
Transparency is a big part of the equation, especially when it comes to proving impact and value. the On their dashboard, they show their efforts towards finalizing grant and funding procedures, increasing positive community interaction, and making sure their services are diverse enough for everyone in Commerce City to enjoy.
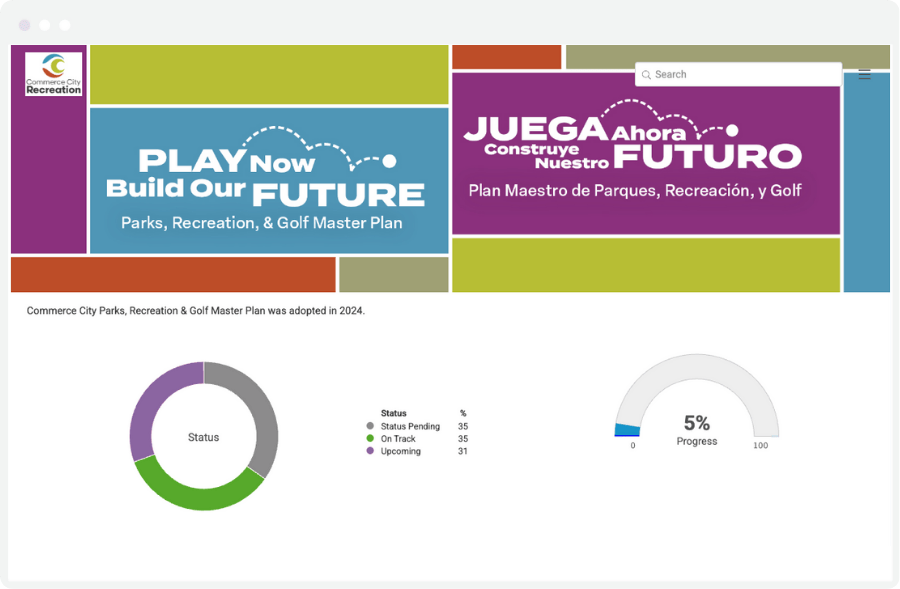
The plan covers also wide range of capital facilities: turf fields, an amphitheater, pickleball courts, splash pads, dog parks, adventure playgrounds, community gardens, shade structures, and more.
Each initiative shows its current progress percentage and status (On Track or Upcoming), and residents can click into any project for detail.
Top Tip
Keep the plan visible after formal community engagement ends. Commerce City published a 51-page PDF and built a live dashboard to keep the plan visible and trackable long after the community engagement process wrapped up.
3. El Paso County, TX: Capital Improvement and Strategic Plan Dashboards
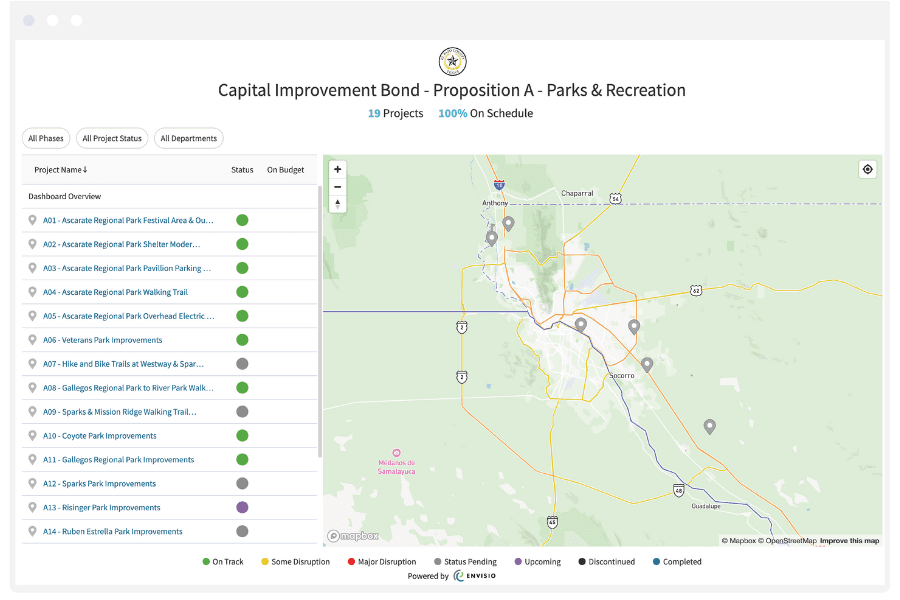
El Paso County reports on infrastructure at two levels: individual capital projects, and the strategic plan those projects roll up into.
Their Capital Projects Dashboard:
- Tracks 19 projects funded through Proposition A of the county’s Capital Improvement Bond, all parks and recreation
- 100 percent on schedule, 100 percent on budget across the board
- Filterable by phase, status, and department
- Each project has a status label and a plain-language update. Ascarate Park’s outdoor stage shows “On Track” with a note on an upcoming community meeting for design feedback
- Completed projects, like the Sportspark Field Lights Modernization, list approved budget against actual expenditure so residents can check the final numbers
Their Strategic Plan Dashboard:
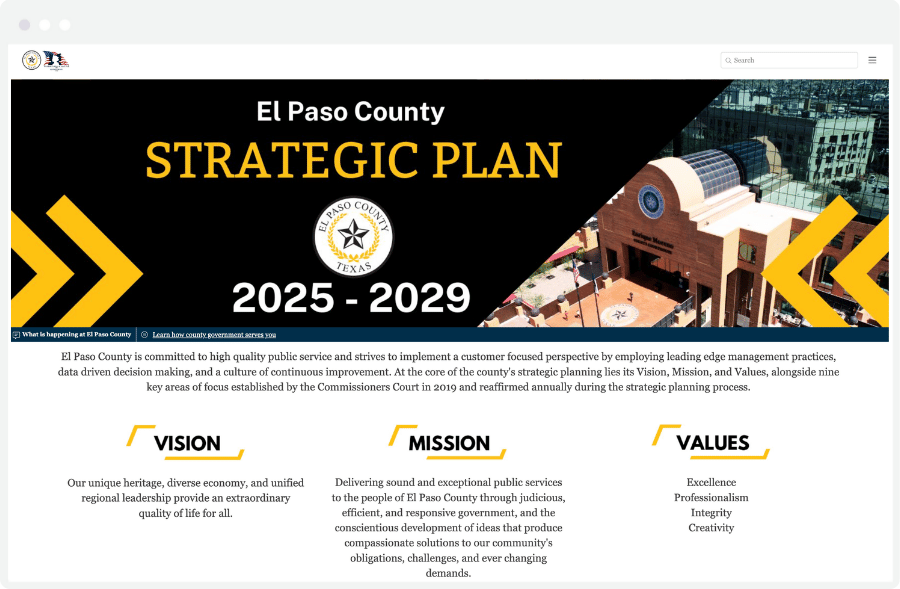
- Outlines El Paso’s Mission, Vision, and Values, from 2025 – 2029
- Details the nine key areas of focus reaffirmed annually during the strategic planning process
- Has projects ranging from infrastructure upgrades (such as enhancing green infrastructure, commencing solar energy research) to increasing tourism (such as developing Ascarate Park)
- Demonstrates transparency about the progress; some initiatives are disrupted, whereas others remain on track
Top Tip
Leverage both a strategic plan dashboard and a project dashboard. El Paso County uses both. That way, residents can zoom in on the project near them, or zoom out to see whether the county’s bigger priorities are moving forward. The project dashboard builds trust one project at a time. The strategic dashboard shows the pattern across all of them.
4. Sonoma County Water Agency, CA: Public Works Dashboard
Sonoma Water has managed water supply, flood protection, and wastewater services for Sonoma and Marin counties since 1949, serving more than 600,000 residents across nine cities and water districts. That scale means a complex infrastructure portfolio across multiple service areas, and a large number of people with a hand in how it’s being managed.
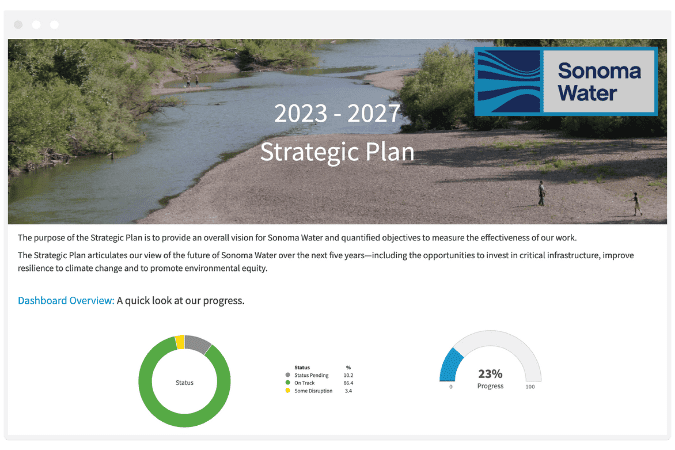
Their public dashboard works on two levels. It tracks progress on the agency’s five-year strategic plan, from goals like infrastructure planning are reported with progress percentages—and it publishes ground-level project details: active projects, contractor, contract value, start date, and estimated completion. Recently completed projects are listed too, which closes the loop on work that’s no longer visible on-site.
Top Tip
Proactively publish details regarding asset management. Sonoma County Water Agency’s range of active projects shows what infrastructure reporting actually covers for a multi-service agency: cathodic protection upgrades on water aqueducts, a diesel fuel tank replacement at a pump station, a sanitation district roof replacement. These details and updates might not end up in a community newsletter, but publishing them proactively on a dashboard is how an agency shows its managing its assets responsibly, long before anyone has cause to ask.
Software Platforms for Tracking Public Works Assets and Generating Council Reports
The organizations above have moved past the quarterly report rebuild, and are actively using infrastructure project management software that both tracks project data in one place, and generates reporting views automatically.
Here’s five things to look for when evaluating platforms for infrastructure reporting in local government:
- Centralized project tracking. All project data (status, budget, timelines, milestones, documents) should live in one system. It will help with reliable reporting.
- Multiple output formats. Council reports and public dashboards have different design and detail requirements. A good platform generates both from a single source of truth.
- Interactive maps. Maps help residents connect the dots between the dashboard and the orange cones on their street.
- Budget and performance tracking. The platform should handle budget vs. actuals alongside status tracking and other project details. Infrastructure project management means following financial performance and physical progress together.
- Strategic alignment tools. Capital improvement projects should connect to your strategic plan. Software that links project data to adopted priorities helps elected officials see how infrastructure spending ties to community goals. This makes it easier to build council reports that tell a coherent story, justify investment, and keep infrastructure work front and center as a priority.
Get a Demo
Most local governments already have the data they need. The hard part is building a consistent process for pulling it together, and keeping that manageable as the project portfolio grows.
A good platform takes most of the work out of the public dashboard. When project data is centralized, publishing a community-facing update is straightforward. The data is already there, ready to share.
Browse Envisio’s capital improvement dashboard examples →
Want to see how it works for your organization? Book a demo →