City of Cedar Park, TX
Cedar Park replaced its capital projects spreadsheet with a public Envisio dashboard that tracks 89 projects, flags disruption honestly, and keeps council and residents in the know.
City of Cedar Park, Texas
Local Government
Ending the spreadsheet shuffle.
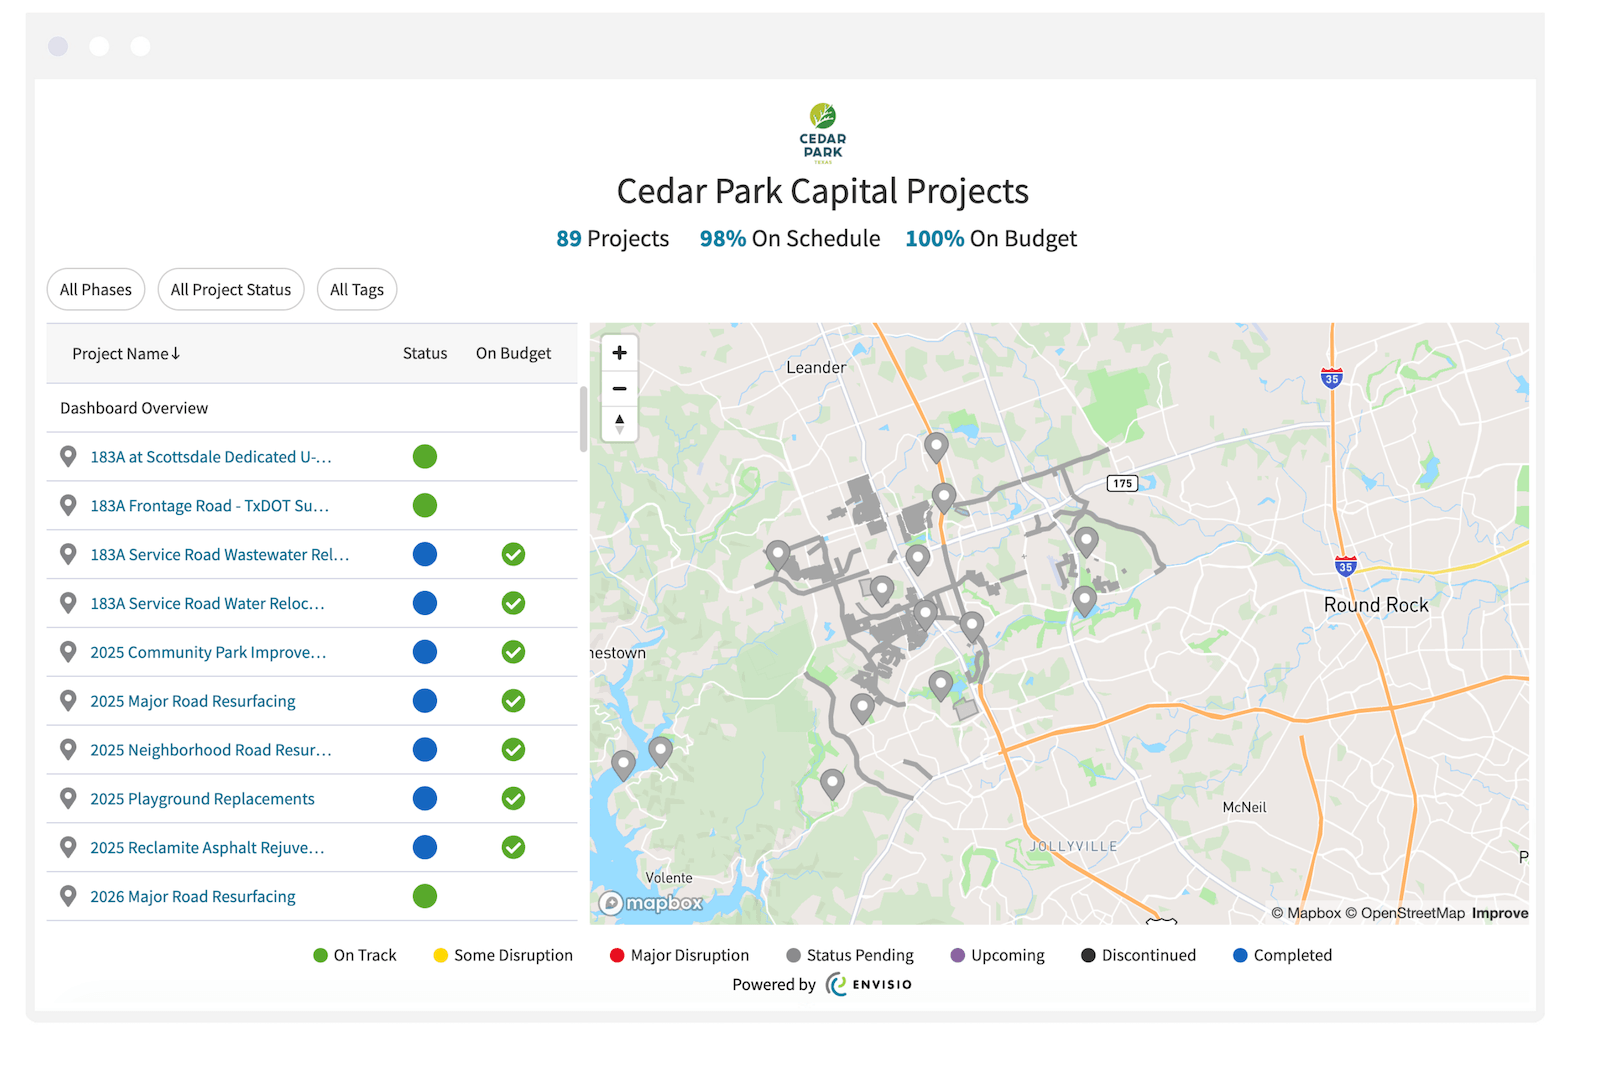
Cedar Park, Texas used to track capital projects in a spreadsheet that was three or four months out of date by the time it reached the public. With Envisio, the city now reports 89 capital improvement projects on a public dashboard, 98% on schedule and 100% on budget, with updates going straight from project managers to residents and council.
Cedar Park: Making capital projects visible
“We all agree that we never want to go back to the old way of doing things again. That was crazy.”
That’s Beau Falgout, Assistant City Manager for the City of Cedar Park, Texas, on how he and his staff feel about the way capital projects used to be tracked. Cedar Park now has 89 capital improvement projects on a public dashboard, 98% of them on schedule and 100% on budget, built and maintained in Envisio.
| 89 Capital Projects | 98% On Schedule | 100% On Budget |
A community that expects data
Cedar Park sits in a region with deep ties to the tech economy. “Apple’s down the road, Tesla, Firefly Aerospace,” Beau said. “Our council’s very tech savvy.”
This proximity to and awareness of tech giants shapes expectations.
“Data-driven decisions and transparency are expectations from our council and our community.”
Beau joined Cedar Park in 2023 and oversees police, fire, emergency management, parks and recreation, and the library. Combined with earlier roles in North Carolina and Florida, he has worked in almost every department within a city function, so he has a lot of experience when it comes to local governments struggling with visibility.
“The challenges are always the same. You have a lot of different projects going on, and a lot of people working on those projects. There is always the challenge of getting visibility to the community and to your council in a more real time than the delayed spreadsheet shuffle that we tend to do in city hall.”
A dashboard for the city’s strategic plan and projects had been a longstanding goal at Cedar Park. “It languished for years,” Beau said. “And when I was hired in 2023, I sort of raised a hand and said, ‘Hey, I would like to tackle this.’”
There was also a practical matter at hand: Cedar Park returns to voters every few years for bond approval on major projects.
“The first question we get is, ‘Well, if you’re asking for more money, what did you do with the last round of funding that we gave you?’”
Cedar Park needed an easier, clearer way to answer that question.
“The spreadsheet shuffle”
That’s Beau’s name for how capital project information moved at Cedar Park before Envisio, and he expects it to be familiar to most people in city hall.
Like many cities, Cedar Park ran capital projects out of a spreadsheet.
“You generally have some massive spreadsheet that you try to manage at a city management level to understand what’s going on,” Beau said. “You may have outside vendors and contractors managing projects that have their own systems. And so it’s really hard to have that one place where you’re gathering the information efficiently.”
Project managers across multiple departments fed updates into that spreadsheet. Three problems followed:
- The language didn’t work for the public. Updates arrived “in some engineering or project management talk, which is not generally very consumable for the public.” And residents want to see progress, not prose. “Most people like to see pictures of projects and see images of the progress.”
- Too many hands. Once the spreadsheet was assembled, it went to the communications team, “who would make it user friendly and rewrite things in order to get it onto the website.”
- It was out of date once it was done. “By the time we got that spreadsheet updated, it was three or four months old,” Beau said. “By the time we perfected the information, it was imperfect, because it was already out of date.”
His verdict: “It was fairly painful for us.”
The change management behind Cedar Park’s capital improvement dashboard
According to Beau, four things helped with the change:
- Executive support. Beau was the executive sponsor, with support at the city manager level.
- Dedicated resources. Cedar Park hired Chance, an ICMA fellow, who was with the city for a year. “That was his primary project: getting our dashboards rolled out.”
- A software solution that helped. “We had a good software solution in Envisio to help us.”
- Managed change. The fourth was the work of bringing people along and building buy-in.
“Change is hard on the human being. So we had to really think about not just the project software we selected, but also how we manage that change with our team.”
The city kept the reporting rhythm it already had. “We were on a quarterly cadence of reporting strategic plan priorities as well as capital projects. We kept that when we moved to Envisio. We just made it a lot easier.”
They also took hands out of the process. “We reduced friction in the process in terms of who had to review and approve,” Beau said. “And so it was allowed to go straight from the project managers into the dashboard.”
The rewrite step that used to sit between the project manager and the website was handled in the platform instead.
“One of the nice features in Envisio was the AI support. So we could take that engineering project manager language, simplify it, and summarize it with the click of a button, which was really nice.”
What keeps updates coming in
Two things keep updates coming in: the Envisio system automates staff reminders, and the city runs a report that shows which projects are missing an update. Visibility handles the rest. “When there’s visibility into the dashboard and they know it goes right to the website, there’s a realization that ‘Oh, I need to get my update done.’”
Some project managers now update more often than they have to. “While they’re required to do quarterly updates, some of them do it on a monthly basis, just because they like the visibility into their projects,” Beau said. “Especially when a project is completed, they want to report on that right away.”
Capital improvement projects, built into the city’s routine
The city’s Capital Projects dashboard is embedded on Cedar Park’s website and covers bond-funded projects as well as projects under the CIP and the Mobility Master Plan.
It shows how many projects the city is executing, what is on schedule and on budget, and where the work is happening across the city.
Users can filter by phase, by status, by whether a project is prioritized for funding, and by parameters Cedar Park added itself.
What makes it stick is that the city built it into work that was already happening:
- Quarterly council updates. Every quarter, the capital projects manager gives a short presentation to city council, highlights three or four projects, and points council to the dashboard for everything else.
- QR codes in the field. Project signs now carry a QR code that goes straight to that project’s page on the dashboard. “So if people are out on the road and want to know more about the project, they can get it there.”
- The city manager’s evaluation. The annual city manager evaluation draws on it. “That report about where the projects are and where our dashboard is goes into her report for her evaluation.”
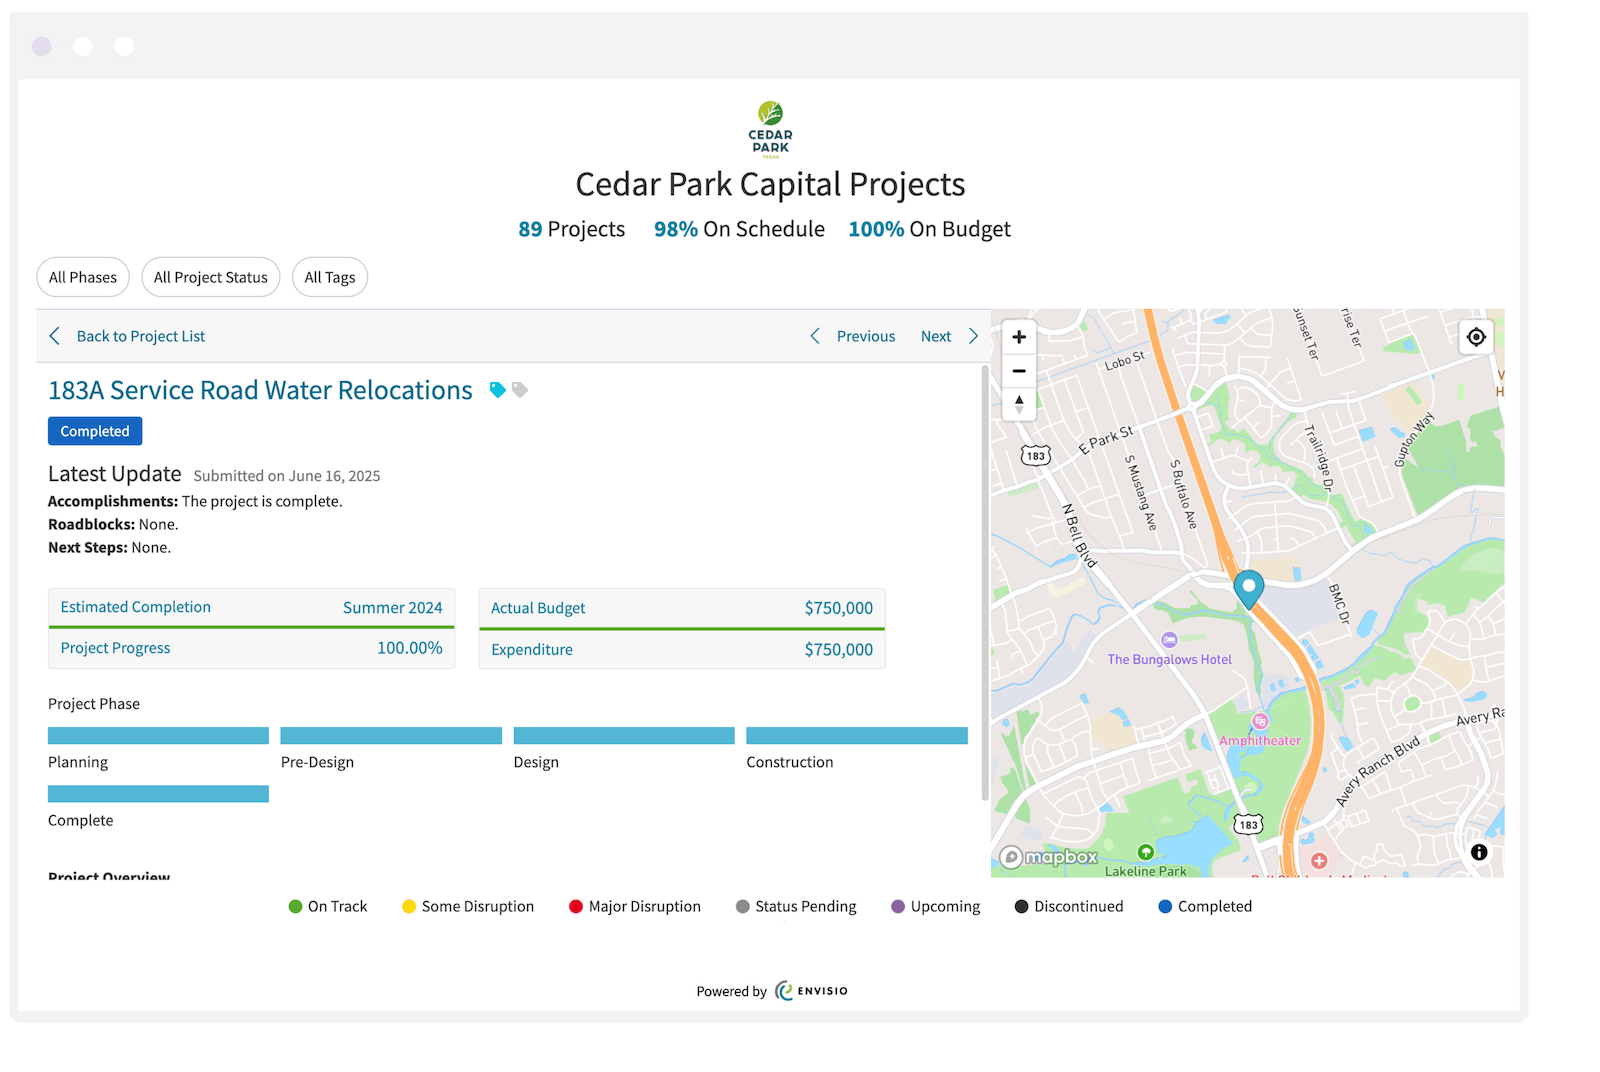
“Our dashboard is definitely fully incorporated into our normal rhythm for reporting and transparency,” Beau said. Even so, the city keeps pointing people back to it.
“We reemphasize every chance we get, to the public, to our community members, to our staff, that the dashboard is the one stop place to find out the status of these things.”
Reporting disruption on purpose
Cedar Park’s dashboard shows when projects hit trouble, and tracks them moving between “disruption” and “back on track.” That was a deliberate decision, and Beau says it was a hard conversation with project managers at first.
“Hey, if you have disruption in your project, you need to let us know and you need to indicate it. It’s okay. Having disruption can be a normal thing.”
The math backs him up: “If all of our projects are going well, we’re probably not telling the truth. It’s almost impossible, with that number of projects, that everything’s gonna get through design and permitting and construction without issue.”
One example is a regional trail connection, a $10 to $12 million council priority that has run into permitting challenges with a state agency. Cedar Park reported it.
The alternative, Beau argues, is worse: “When people go, hey, you said that wasn’t gonna be delivered by this date, and now it’s this date, if we go to the dashboard and it says everything’s good, it’s on track, you’re gonna lose all credibility.”
He is direct about how uncommon this level of transparency still is in government organizations.
“It’s very hard, I think, for local governments to have strategic plan dashboards and KPIs and capital projects and admit that sometimes things don’t go a hundred percent. You don’t hit a home run every time at the plate.”
Disruption flags work as a management tool
Internally, disruption flags are also a useful management tool. “From a city manager’s office standpoint, we look at the projects with disruption and see if there’s something we need to do to influence that,” Beau said. That might mean lobbying a state agency, adding resources, or recognizing that a project manager is carrying too much. “We don’t want to be surprised down the road when there’s something that we could have done to get that project back on track.”
What staff can tell council about a delayed project
A second example from Cedar Park highlights what having the dashboard does day to day for the city. Cedar Park’s Re|Create project converts the old library into a parks programming space. It was a council initiative, and the goal was to open by summer, but there was a delay.
“Since it’s a very visible project, we get questions about how it’s going,” Beau explained. Without the dashboard, the answer would be approximate. “If I rely on my memory, I would say something like, ‘I think there’s some delay with some equipment and we found something when we were renovating.’”
But with the dashboard, the answer about the delay is specific. “I can just go straight to the dashboard and see that we had moisture in the exterior wall, so we had to remediate that.”
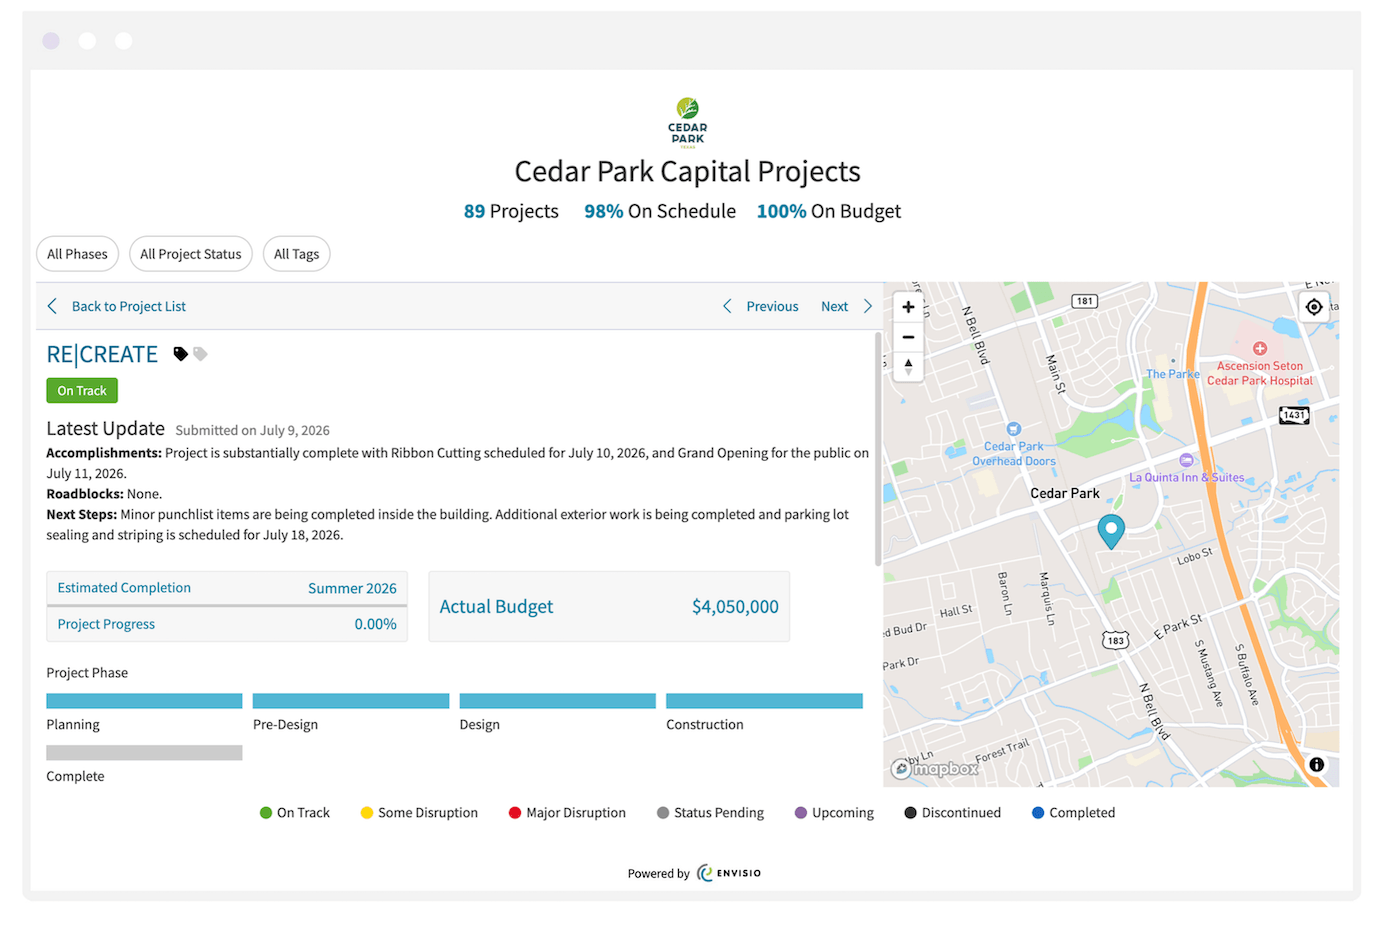
The project has since been back on track, which is reflected on the dashboard. The project also carries the latest staff update, the phase and budget, the location on a map, and design images.
Capital improvement linked effortlessly with strategic plans
The Recreate capital project is also linked to Cedar Park’s Strategic Plan dashboard.
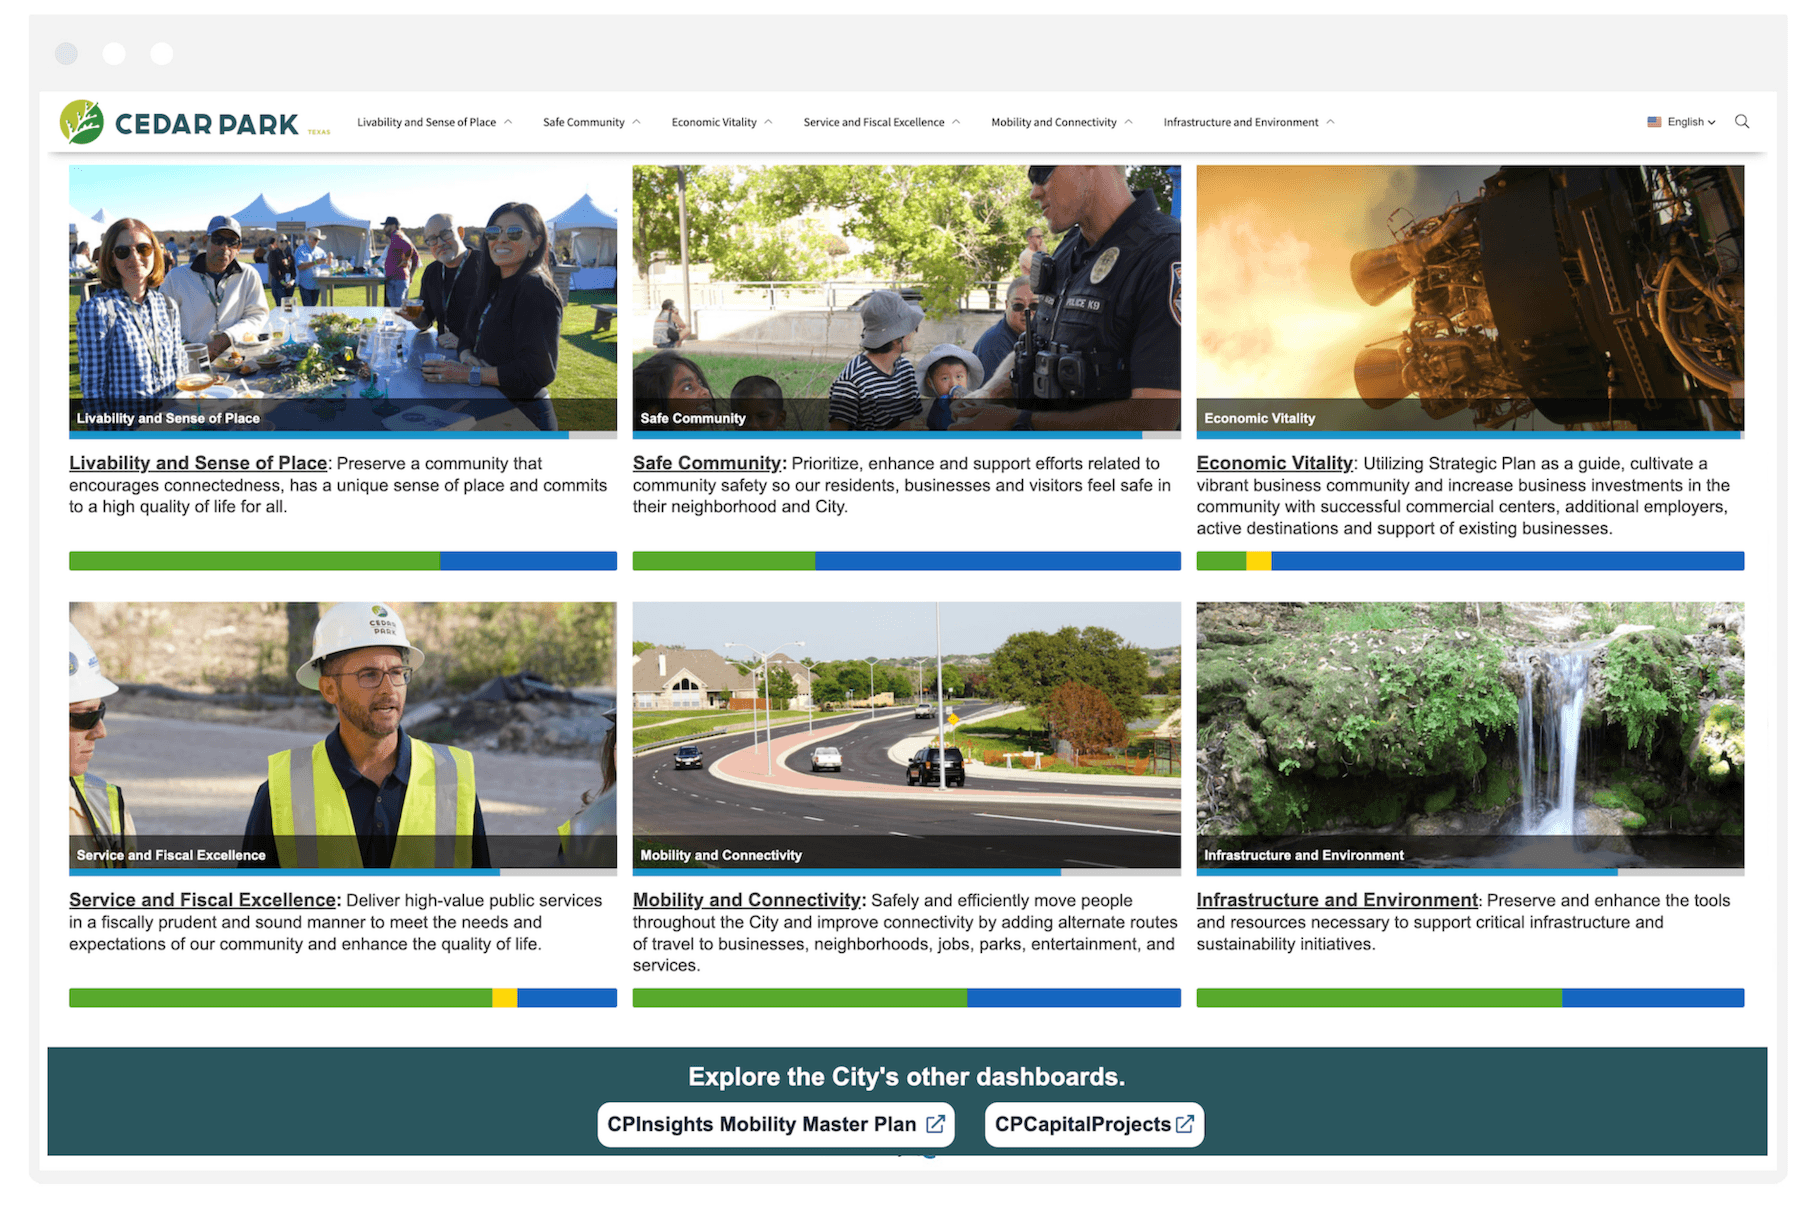
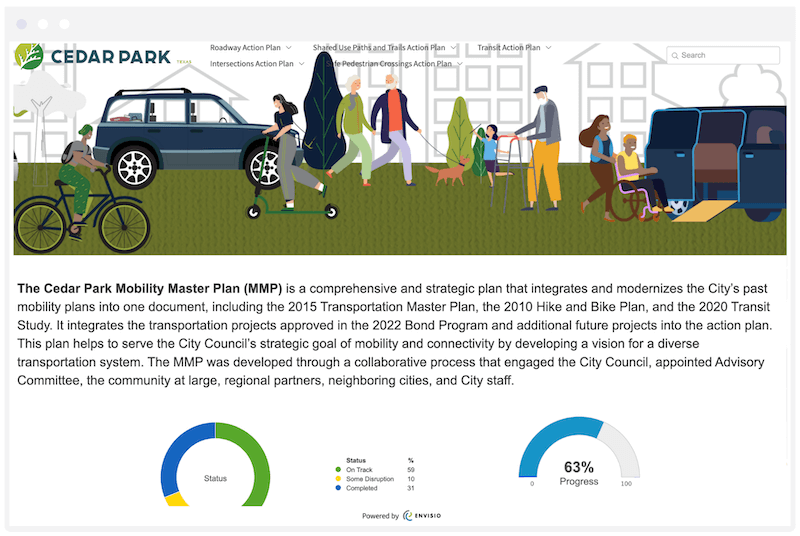
Cedar Park’s strategic plan dashboard covers six goals, each with strategies, initiatives, and projects beneath them, plus performance indicators. The city has also brought several master plans together under one umbrella, including the Mobility Master Plan, so council and other audiences can see progress across multiple action plans in a single view.
Choosing what to measure took its own discipline.
“What I’ve learned over the years is every department head will want to measure how much work they do. But the real goal is the impact to the community.”
Training that didn’t take long
Cedar Park’s experience with onboarding was short. “Envisio is easy to use and get up and running,” Beau said.
For project managers, initial training with Envisio staff took “an hour or less” to learn how to update a project. In practice, most don’t need much more complex training at all: “They usually get an email right in their inbox. They click on the link and can enter updates right from there.”
Administration of the system takes more training, but not much. After Chance was promoted to utilities, an intern took over. “She picked it up in less than 30 days and was administering both the capital projects dashboard and the strategic plan and MMP dashboard.”
| 1 Hour or Less Project Manager Training | Under 30 Days For a New Admin to Get Up to Speed | 1 Email Per Quarter, Down From ~25 a Month |
When it started feeling like less work
Asked when the new process stopped feeling like extra effort, Beau separated the software from the culture.
On the software: “A few months.”
On the change management: about a year. But he’s precise about what changed. “It took time, but it became accepted by the organization.”
The comparison that lands hardest for project managers is the one they left behind. “With the old way, they would get 25 different emails over the course of a month about what the status of a project was. Now, it’s one email reminder every quarter.”
“They’re definitely on board and absolutely don’t want to go back.”
Want to hear more from Beau? Watch the Improving Transparency in Capital Projects webinar, or browse more capital improvement dashboards.
Cedar Park’s capital projects in view
Cedar Park shows residents and council exactly where 90 capital projects stand, including the ones that hit trouble.