Contents
- What Business Intelligence Tools Are Designed to Do
- What Envisio Is Designed to Do
- The Right Tool for the Job: A Practical Comparison
- Metrics vs Dashboards: An Important Distinction
- Implementation and Adoption Matter as Much as Software
- Can We Use Both Envisio and Power BI?
- Aligning Tools With Organizational Needs
Summary
Choosing between Envisio and Power BI is a matter of fit. Power BI supports deep analysis. Envisio helps public sector teams follow through on plans, track progress, and report performance.
Key Takeaways:
- Power BI is great for teams with the capacity to build and maintain complex data models.
- Envisio is purpose-built for the public sector. It keeps plans, projects, and performance connected and visible.
- Some organizations use both: Power BI for analysis, Envisio for reporting and alignment.
When organizations compare reporting and analytics tools, the conversation usually starts with features; which one has more? But the better question is simpler: What are you actually trying to do, and with what capacity?
In the public sector, budgets are tight, and staff time is tighter. Expectations for transparency and visible results keep rising. The tool that you pick will be the right one if it helps you get what you need to get done, with the resources you have.
As one of my colleagues describes it, Do you need a chainsaw to do minor gardening?
If you’re clearing a forest, a chainsaw makes sense. If you’re tending a garden, it might slow you down, or require more expertise than you have available.
That framing is useful when comparing Envisio and Power BI. Both are strong tools, but they are simply built for different jobs.
This post is about helping you figure out when Envisio makes sense, when Power BI makes sense, and how organizations often use both Envisio and PowerBI together.
What Business Intelligence Tools Are Designed to Do
Business Intelligence (BI) tools exist to help organizations analyze data and support decision-making. At their core, they focus on:
- Connecting to raw data
- Transforming and modeling that data
- Visualizing trends and patterns
- Supporting analysis across datasets and systems
Power BI is a leading example in this category. It is a great tool, widely used across many industries and departments to slice and dice data, build dashboards, reports, and analytical views that help organizations understand what is happening.
BI tools are powerful, flexible, and highly configurable, especially when organizations have the skills and capacity to support them.
When Power BI is a Strong Fit
Power BI a strong fit for organizations that need a lot of depth in how they analyze data.
Power BI works best in environments where there is already internal capacity to manage data models, support the ongoing maintenance of data and dashboards, and iterate on reports over time.
For teams with dedicated analytics staff, Power BI can support deep exploratory analysis and sophisticated analytical work.
Local governments that have a dedicated internal data science department, for instance, might opt for Power BI because of its ability to support complex reporting across multiple systems.
In this environment, the value comes from Power BI’s ability to adapt to evolving questions, even if that requires more setup, training, and ongoing management. Power BI functions as a powerful analytics layer, enabling teams to ask in-depth questions of their data and build highly customized reports. For organizations with strong internal BI capacity, that flexibility is a major advantage.
Where BI Tools Reach Their Limits
While BI tools are excellent at visualization and analysis, they are not designed to manage strategy execution on their own. Common challenges organizations encounter include:
- Metrics that exist in dashboards but are not clearly tied to strategic goals
- Reports that are technically impressive but difficult for non-technical users to maintain
- Heavy reliance on a small number of skilled staff
- Difficulty standardizing performance reporting across departments
-
Dashboards that answer “what happened?” but not “how are we doing against our plan?”
These aren’t failures of BI tools. They’re simply outside their core purpose.
What Envisio Is Designed to Do
Envisio is built for a different, specific job: helping organizations execute strategy and report on performance in a clear, consistent, and sustainable way.
Because Envisio is purpose-built for the public sector, the capabilities it has are also specifically designed to meet the unique pain points we see across that sector.
So, rather than starting with raw data, Envisio starts with strategic and operational plans, organizational priorities, major projects and initiatives, performance measures tied to outcomes, and transparency.
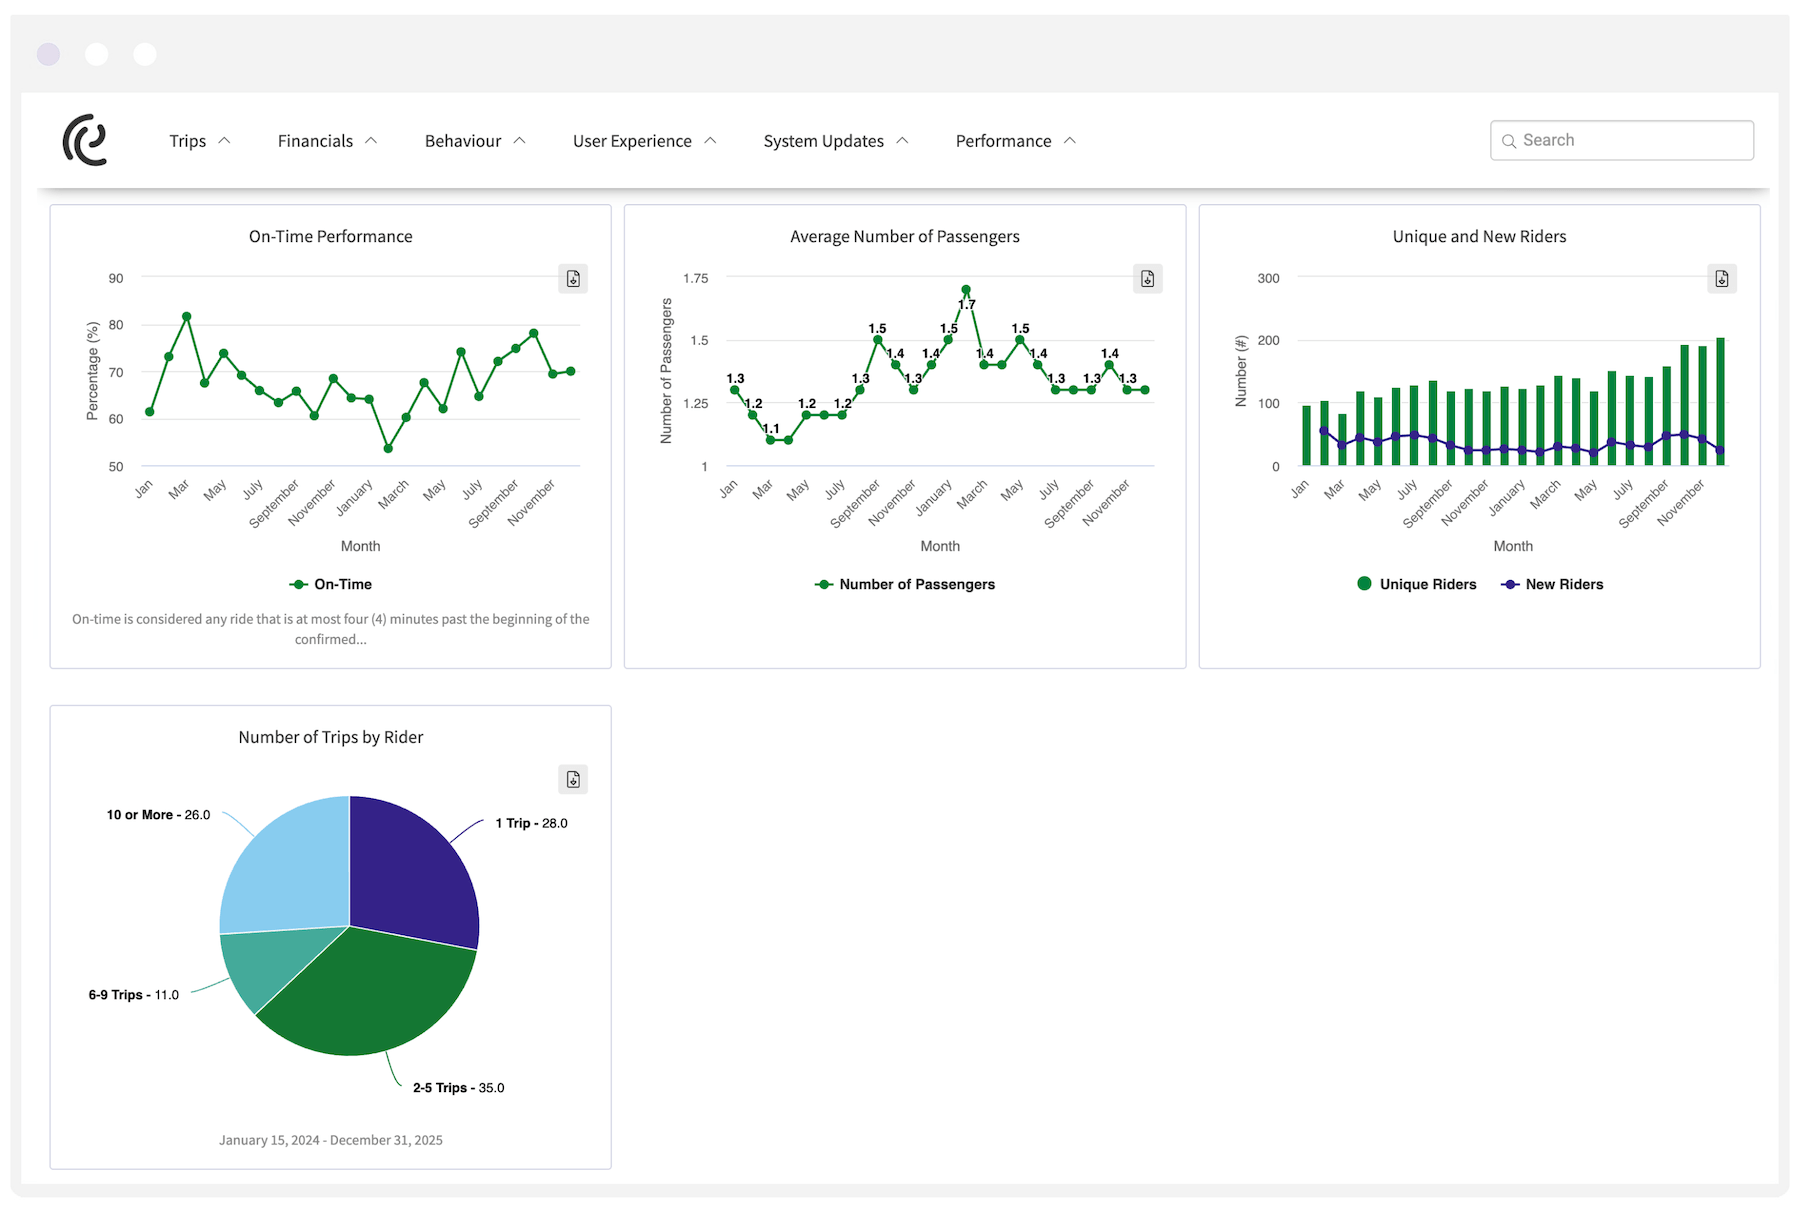
Municipality of North Grenville’s transit dashboard: displays their performance data on their Envisio public dashboard.
The Envisio platform is designed so that metrics are directly linked to plans, projects, and departments, making it easier to see progress, identify gaps, and communicate results.
Envisio does have a powerful Analytics platform—and we could talk your ear off about measuring what matters—but it’s not the same kind of tool as Power BI. Envisio’s focus is making sure strategy is operationalized and visible across the organization, and beyond.
When Envisio Is a Strong Fit
Envisio is a strong fit for local governments and public sector organizations that need a consistent way to manage and report on strategy over time. It works best when the primary goal is to track progress against strategic and operational plans, connect performance measures to projects, programs, and departmental work, and share that information clearly with leadership, staff, and the public.
Envisio is designed for organizations where performance reporting is a shared responsibility across departments.
In these cases, the value comes from having a platform that makes it easier to define meaningful measures, maintain them through planning cycles, identify problems early, and keep reporting aligned with how the organization actually plans and operates.
For many public sector organizations, this reflects reality:
The majority of reporting work is performance tracking and data storytelling tied to plans, not advanced data science.
The Right Tool for the Job: A Practical Comparison
To make the differences clearer, here’s a high-level, non-technical comparison focused on how each tool is typically used.
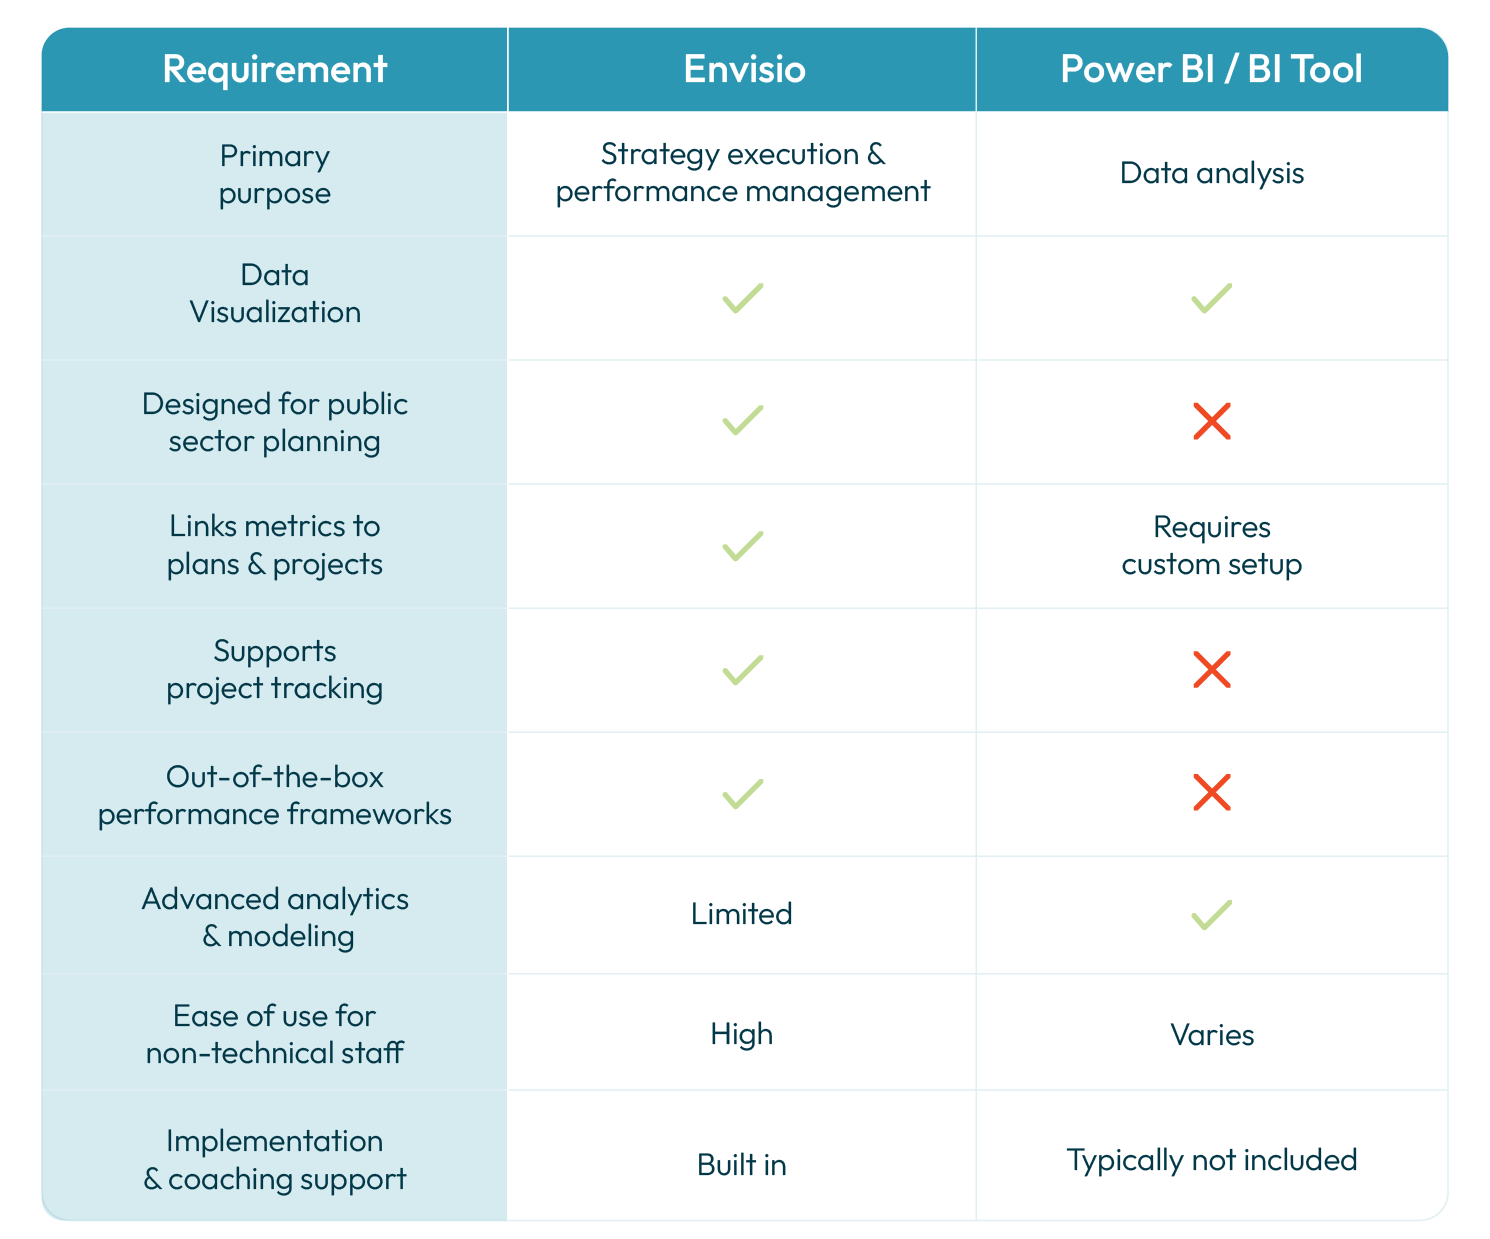
Again, this table isn’t about which tool is “better” or “worse”, it’s about the design intent of the tool.
Metrics vs Dashboards: An Important Distinction
One of the most overlooked differences between BI tools and Envisio is the role of performance metrics.
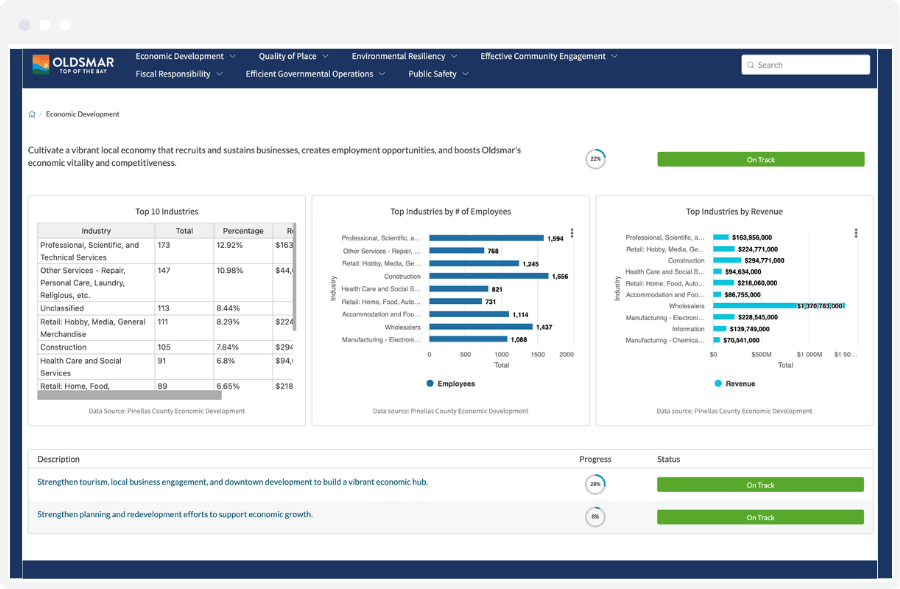
The City of Oldsmar, Florida shows their economic development progress on their Envisio public dashboard.
BI tools excel at showing data once it already exists, and is well-modeled. Whereas Envisio focuses on helping organizations:
- Define meaningful metrics
- Tie metrics to strategic objectives
- Assign ownership
- Update metrics consistently
-
Roll up progress and measures for leadership and public reporting
Envisio is good for making sure metrics are tied to the strategy. This distinction matters because many organizations struggle less with visualization and more with agreeing on what to measure, ensuring consistency across departments, and maintaining a good reporting cadence.
Implementation and Adoption Matter as Much as Software
Tool comparisons often assume a level of time and expertise that many organizations simply do not have.
In practice, teams are balancing limited analytical capacity, competing priorities, staff turnover, and pressure to demonstrate progress within short reporting cycles. In that context, complexity can become a risk rather than an advantage.
Business intelligence tools are great, but they often depend on significant setup, ongoing maintenance, and internal expertise to keep reports consistent and usable over time.
“The team that Envisio put in front of us felt like the right choice—and that’s proven true time and time again.”
Envisio takes a structured approach with full implementation support, and workflows designed to help organizations maintain continuity in their reporting and performance management, even as staff roles and priorities change.
Envisio also offers professional services to support local governments and other public sector organizations as they define performance measures, align reporting with their plans, and establish repeatable reporting practices. These services are typically used to supplement and grow internal capacity; organizations might choose Action Planning Workshops, or Performance Measurement Workshops to get better at refining metrics and reporting approaches over time.
Can We Use Both Envisio and Power BI?
Yes! Many organizations use both.
A common and effective method looks like this:
- Power BI is used by analytics or finance teams for deep data exploration.
- Envisio becomes the system of record for plans, projects, and performance reporting.
In this setup:
- Power BI answers complex analytical questions.
-
Envisio communicates progress, alignment, and outcomes.
Envisio is built for integration. The platform works with the tools and data many public sector organizations already use. It includes an Open API so you can bring in data from your own systems and automate updates rather than entering information manually.
Envisio also has a number of native connections with budgeting and collaboration tools so that your performance information stays current and leverages your existing workflow tools.
Aligning Tools With Organizational Needs
There is no single “best” reporting or analytics platform. There is only the tool that best supports the work you need to do right now.
Choosing between Envisio and Power BI is ultimately a question of fit, not capability.
Power BI is well suited to organizations that need flexibility and depth in data analysis and have the internal capacity to support that work.
Envisio is designed for organizations that need a clear, structured way to execute strategy, track performance, and communicate progress across departments and other relevant parties.
And the great news is, you can always use both, and get the best of both worlds!
Ultimately, the right choice is the one that aligns with your organization’s goals, capacity, and reporting reality… and, of course, the one that helps you make progress on the goals that matter the most to your organization and the community you serve.