Contents
In our Measure What Matters series, we’ve been providing real examples of local government departmental performance measures, drawn from our database of measures from over a hundred cities, towns, and counties across the US and Canada.
Today, we’re focusing on fire department performance measures—and how departments are using data to assess, communicate, and improve service delivery.
Fire departments play an essential role in ensuring community safety across North America. Beyond responding to fires, they are often first on scene for medical emergencies, accidents, and disasters.
They also play a critical role in prevention and public education.
Developing the right performance measures—and tracking them consistently—allows fire departments to evaluate service quality, identify gaps, and communicate results. Just as importantly, it provides the data needed to support budget requests, operational changes, and long-term planning.
We’ve analyzed our database of over ten thousand performance measures to highlight five of the most widely used fire department performance metrics, along with real-world examples from Envisio customers.
Why Performance Measures Matter for Fire Departments
Fire departments play a critical role in their communities: they are trusted, highly visible, and essential to public safety, but their impact can be difficult to capture through a single metric. A single response can involve emergency medical care, fire suppression, rescue operations, and coordination with other agencies—all within minutes.
Clear performance measures help fire departments navigate this complexity. When aligned with a strategic plan, KPIs support several key functions:
Clarifying priorities: Performance measures translate broad goals—such as response effectiveness, prevention, and community safety—into specific, trackable areas of focus.
Supporting transparency: Public dashboards allow residents to see how the department is performing against response time targets, service levels, and safety outcomes.
Strengthening internal alignment: Staff can better understand how daily operations, training, and resource allocation contribute to broader departmental goals.
Building credibility: Consistent measurement helps elected officials and funders understand operational needs, justify investments, and evaluate outcomes.
Across the fire departments we reviewed, the most effective performance frameworks did not rely on a single “perfect” metric. Instead, they used a balanced set of indicators that together told a clearer story about response performance, service demand, prevention efforts, and overall community impact.
Common Fire Department Performance Measures (With Examples)
Fire departments across North America rely on a core set of performance measures to understand how effectively they are responding to emergencies, how demand for services is evolving, and where to focus limited resources.
While the specific mix of measures varies by community, several indicators appear consistently across fire department dashboards and performance reports.
Below are some of the most common fire department performance measures, along with examples of how departments are tracking and reporting them in practice.
1. Fire Response Times
Definition: Average length of time it takes for the fire department to arrive after a top-priority call is received, typically measured in minutes and seconds.
Response time is one of the most critical fire department performance measures. It directly impacts outcomes in fires, medical emergencies, and rescue situations. Most departments track not just average response time, but the percentage of calls meeting a defined target (e.g., arrival within 6 minutes and 20 seconds).
Tracking this over time helps departments identify coverage gaps, staffing needs, and station placement considerations. It also provides a clear, easily understood metric for elected officials and residents.
City of Celina, Texas
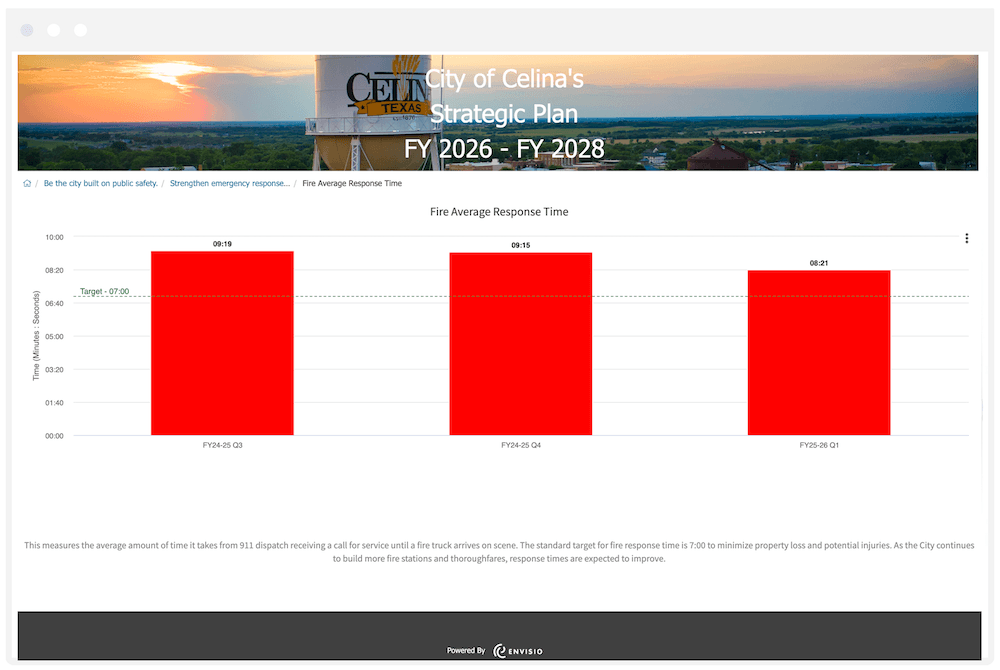
The City of Celina tracks fire response time from 911 dispatch to arrival on scene, with a target of 7 minutes to minimize property loss and potential injuries.
This measure is part of a broader public safety strategy focused on scaling fire and EMS capacity alongside rapid population growth. Rather than treating response time as a standalone metric, Celina connects it directly to infrastructure expansion, dispatch improvements, and emergency preparedness efforts.
As new fire stations and road networks are developed, the city expects continued improvements—demonstrating how performance measurement can guide long-term investment in service delivery.
City of Baytown, Texas
The City of Baytown, as part of their initiative to track feelings of safety, tracks and displays 1st engine travel time to building fires as a key component of its response time performance.
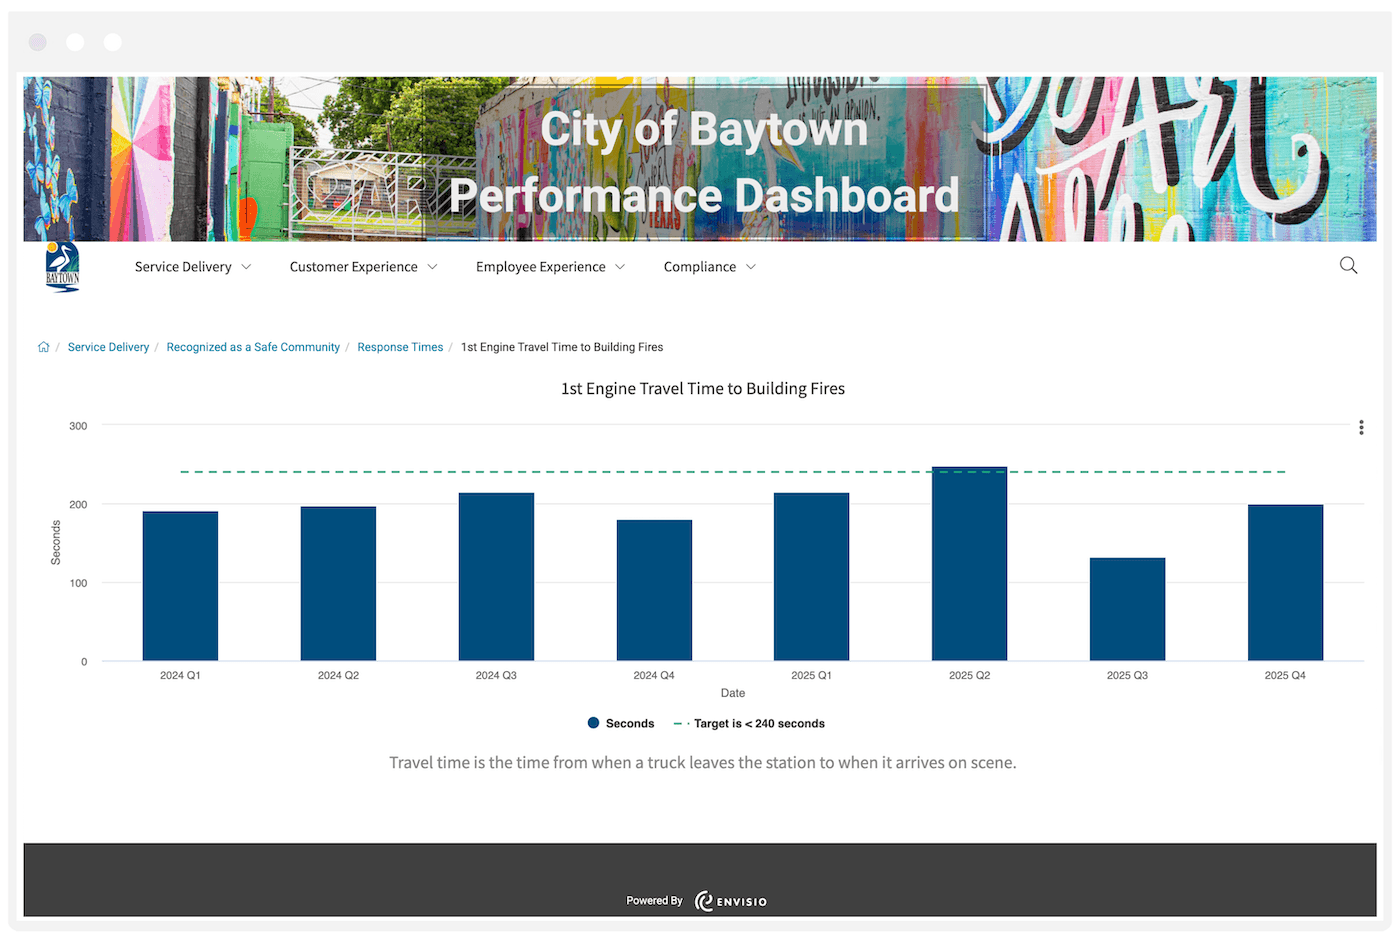
Baytown reports this data quarterly and evaluates performance against established response time targets. Recent updates show consistent performance, with no significant changes despite an expanded service area.
2. Number of Incidents
Definition: Number of reported fire response incidents.
In our data, this is sometimes measured per 1,000 residents or per 100,000 residents, quarterly or annually. Tracking the number of incidents helps fire departments understand overall demand for service and how that demand is changing over time.
On its own, “incident volume” doesn’t indicate performance. But, when paired with response times and outcomes, it becomes a key input for staffing, resource allocation, and long-term planning.
It also helps departments identify emerging trends—such as increases in climate-related incidents, extreme weather events, or wildfire risk—allowing them to plan proactively and adapt service delivery to changing environmental conditions.
City of Woodbury, Minnesota
The City of Woodbury, Minnesota, measures the number of incidents annually as part of its Performance Measures Dashboard.
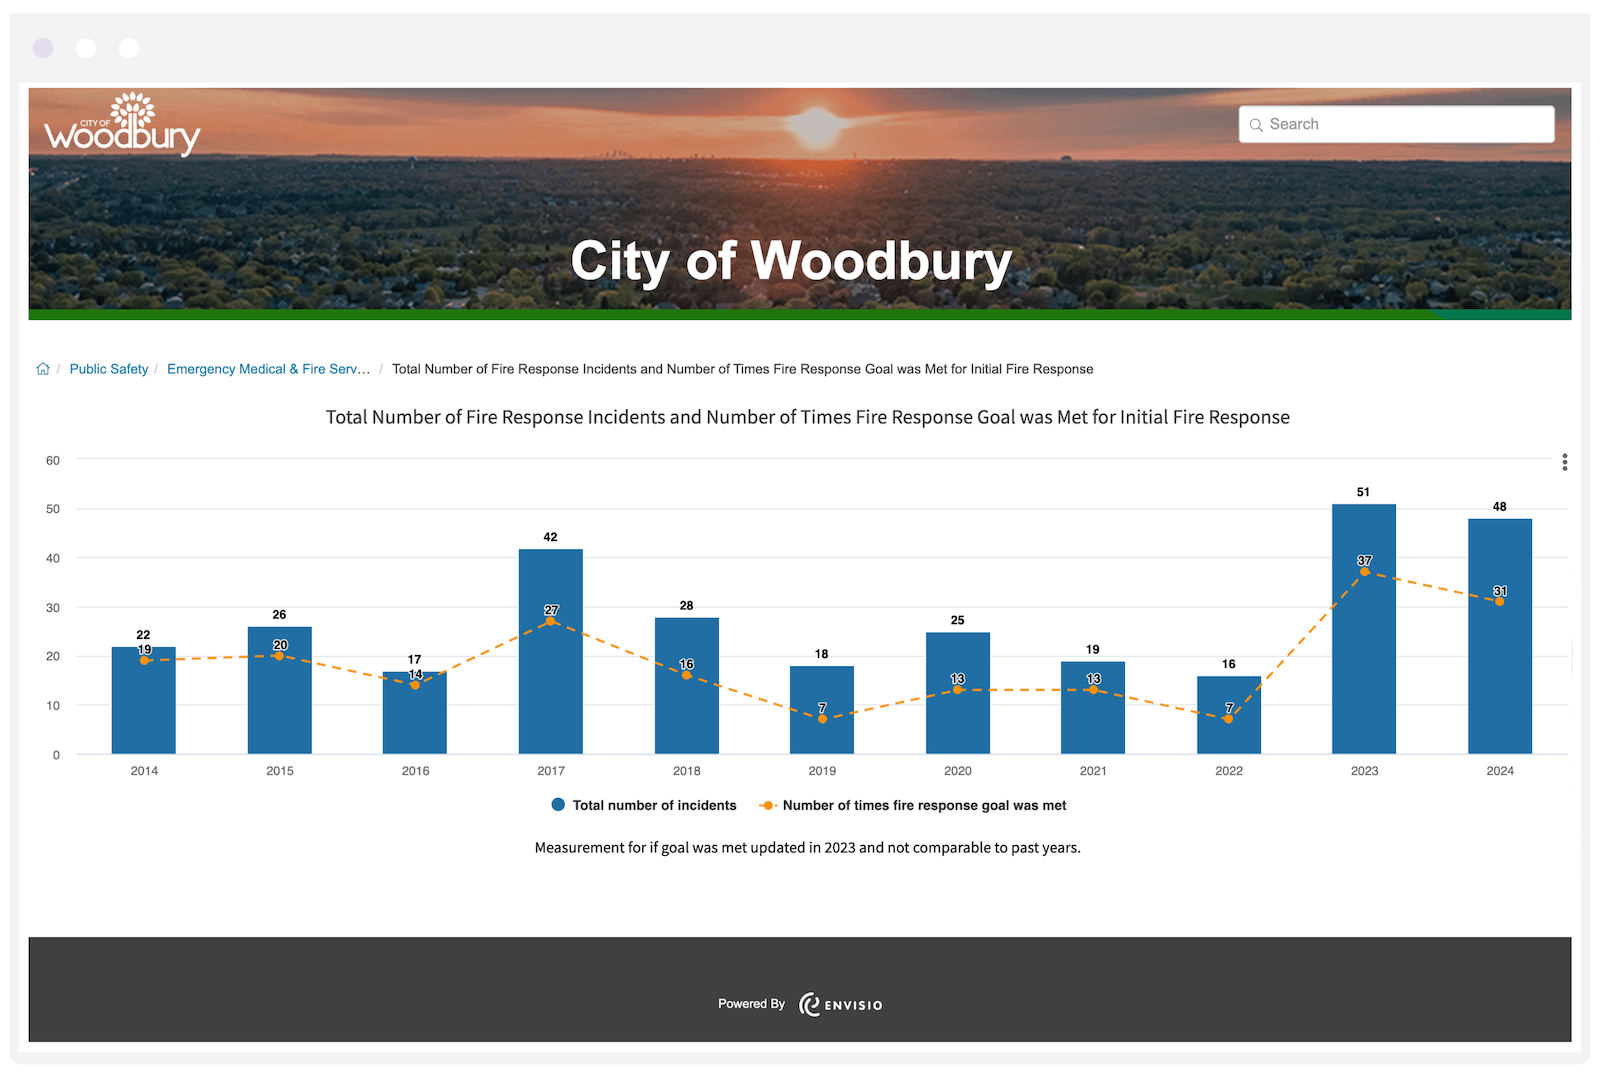
Woodbury also charts the number of times the city’s fire response goal was met.
3. Fire Department Satisfaction (Community Survey)
Definition: Usually a percentage of residents who report that they feel satisfied with the services provided by their neighborhood fire department.
Community surveys give fire departments a way to understand how residents experience their services beyond response times and incident data. They capture perceptions of safety, professionalism, communication, and trust—factors that are harder to measure operationally but are critical to public confidence.
These surveys also create a structured way for residents to provide feedback, helping departments identify gaps in outreach, education, or service delivery.
Measuring satisfaction helps departments close the loop between service delivery and community expectations. It provides leadership with actionable insights, supports more responsive decision-making, and strengthens accountability by making public perception visible over time.
City of Minnetonka, minnesota
The City of Minnetonka measures the level of community satisfaction with fire protection services annually and reports results via its Strategic Profile & Community Dashboard. This includes a breakdown of how residents rate services—such as Poor, Fair, Good, or Excellent—providing a clearer view into public perception over time.
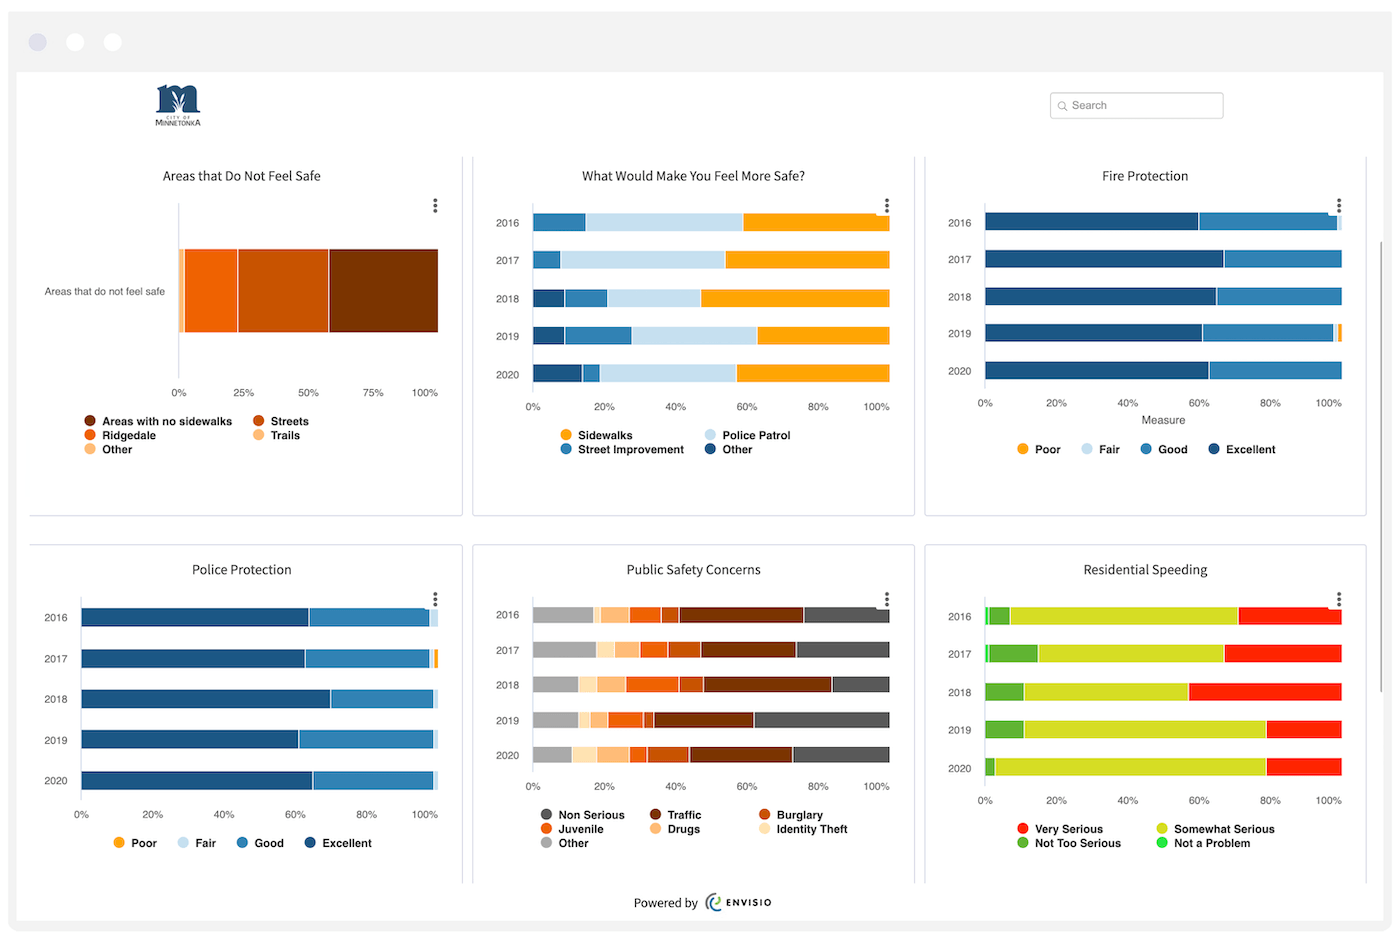
Minnetonka also actively engages residents through broader community surveys, inviting input on facilities, services, and priorities. This ongoing feedback loop helps ensure that performance measurement is not just retrospective, but informed by resident expectations—allowing the city to align fire services with evolving community needs.
4. Fire Department Accreditation
Definition: Number of accreditations achieved or maintained by a fire department, typically through recognized third-party organizations, such as the Commission on Fire Accreditation International (CFAI).
Accreditation is a higher-level fire department performance measure that reflects overall organizational quality rather than a single operational outcome. It captures whether a department meets established standards across areas such as governance, staffing, training, resource allocation, and community risk reduction.
Tracking accreditation status—or progress toward it—signals a commitment to continuous improvement, transparency, and accountability. Unlike metrics such as response time or call volume, accreditation evaluates how well the entire organization functions, making it a valuable indicator of long-term performance and readiness
City of Denton, Texas
The City of Denton’s Fire Department has their own strategic plan dashboard. On it, the department tracks achievement and maintenance of fire department accreditation as a key performance measure, reflecting organizational quality, accountability, and continuous improvement. Rather than focusing solely on operational outputs, this measure captures the department’s ability to meet internationally recognized standards across all aspects of service delivery—from governance and training to community risk reduction and emergency response.
Tracking accreditation status—and maintaining it over time—signals to residents and leadership that the department is operating at a high standard and actively working to improve.
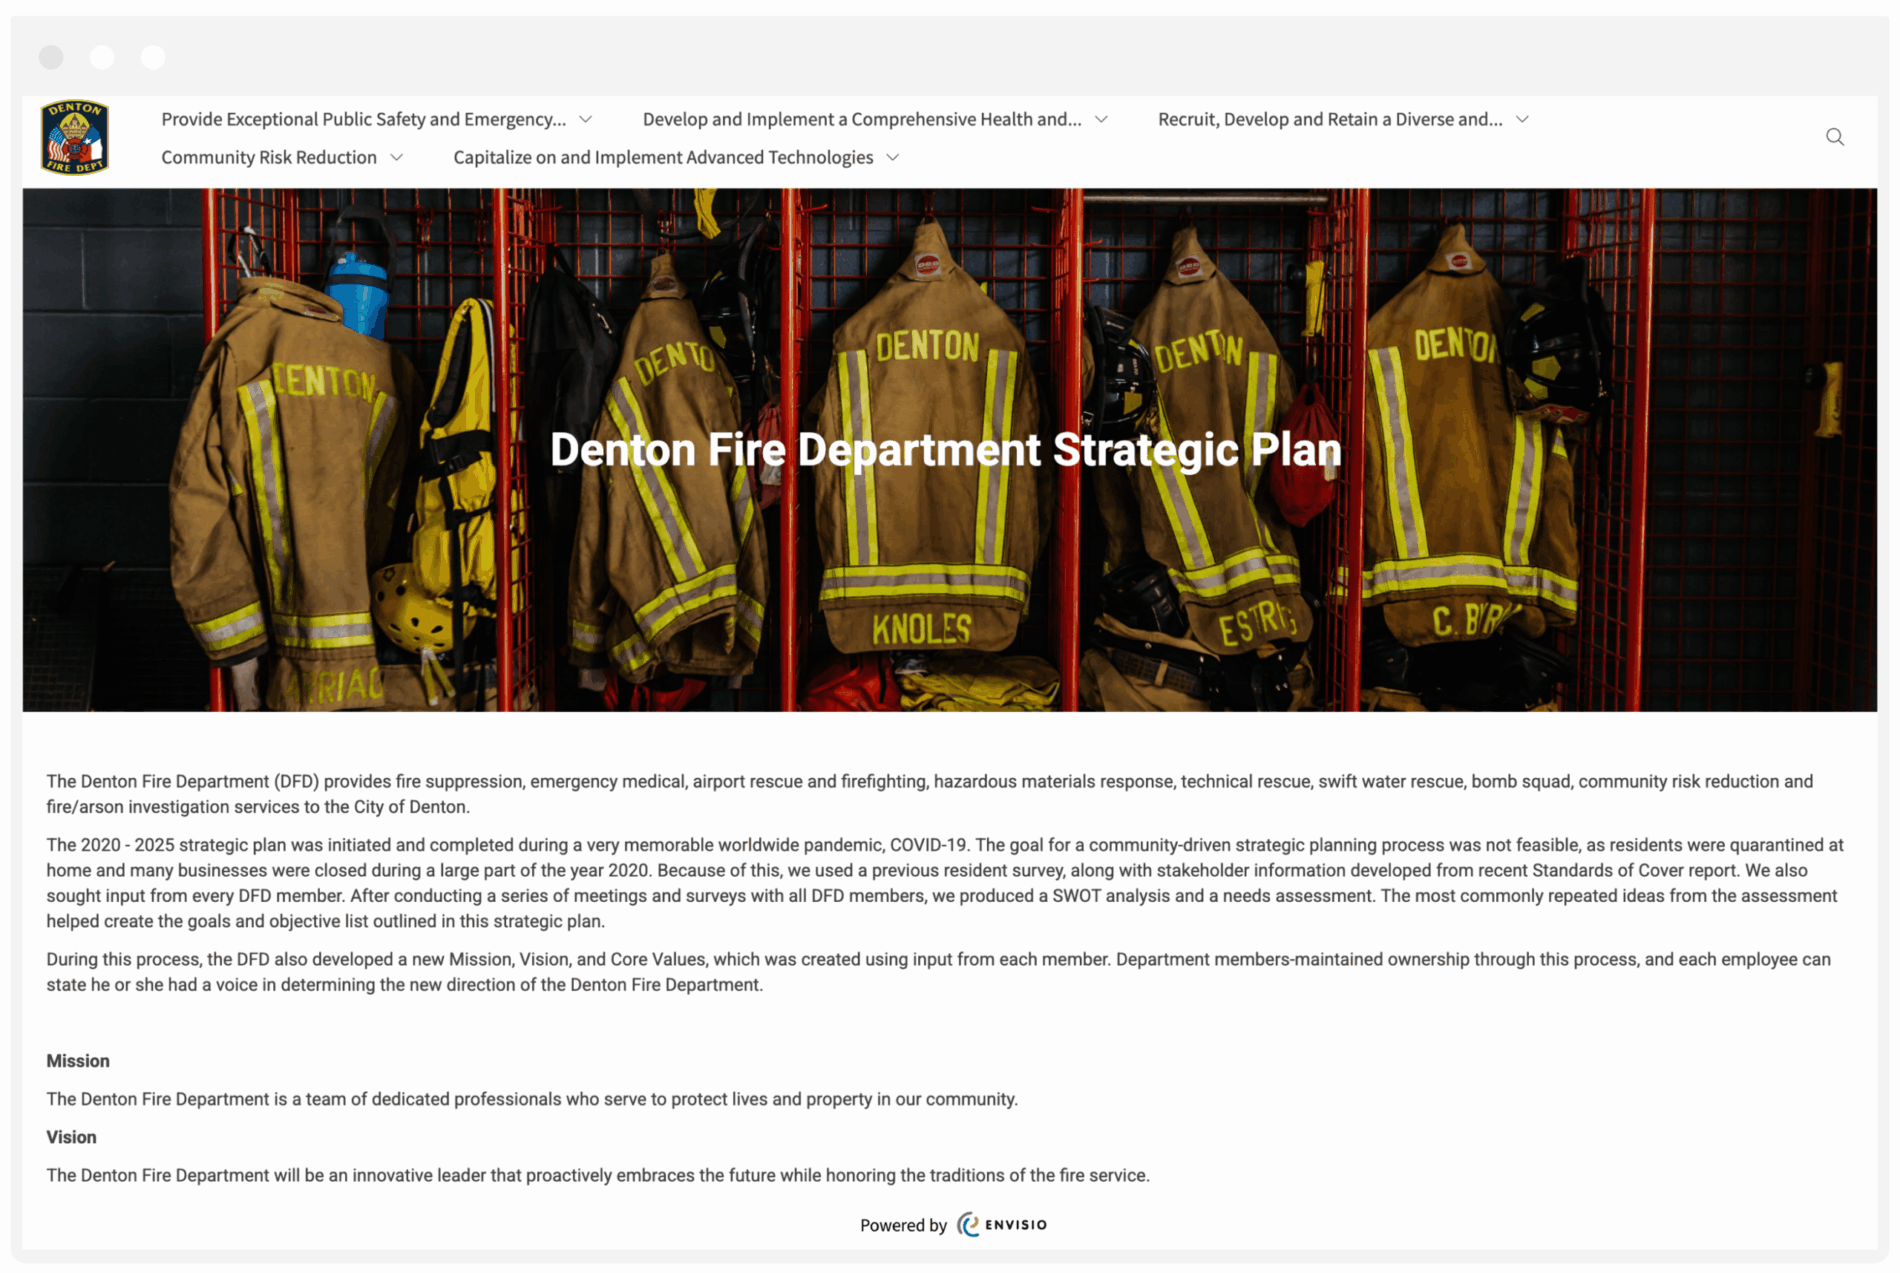
Denton Fire Department achieved Accredited Agency status through the Commission on Fire Accreditation International (CFAI), a rigorous third-party process that requires comprehensive self-assessment, strategic planning, and ongoing evaluation.
Denton is one of a limited number of agencies to receive this designation.
5. Number of Calls for Fire Service
Sometimes measured as the number of calls per resident, this metric helps normalize service demand across communities of different sizes. It is typically tracked quarterly or annually to identify trends in call volume, peak demand periods, and shifts in service needs.
Over time, this measure can reveal changes in population, risk exposure, or reliance on fire and EMS services—making it a useful input for staffing, budgeting, and resource planning.
City of Brookings, South Dakota
City of Brookings, South Dakota, measures total number of fire department calls for service annually (together with a great analysis of the data) as part of the city’s Insight Performance dashboard:
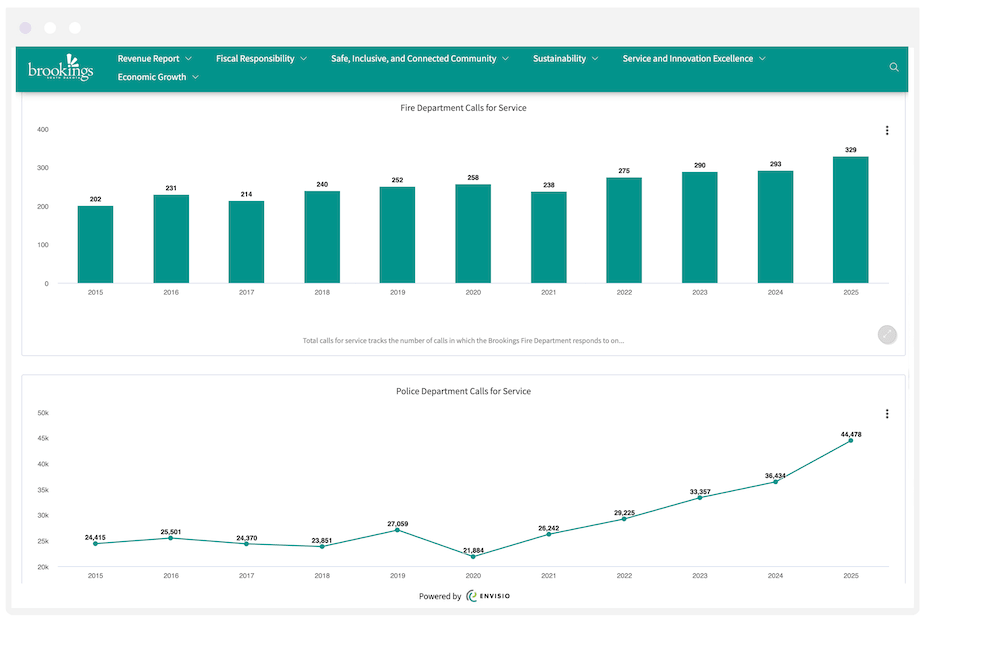
Brookings uses this measure to help them understand trends and inform future fire service decisions. Their data shows a steady rise in calls for service, reaching a record 329 responses in 2025—well above the 10-year average of approximately 240. This increase is driven by growth in hazardous-condition and general service calls, along with a consistent pattern where false alarms account for roughly 25% of total incidents.
Other Fire Department Performance Measures
Other common fire department performance measures that we found in our database include:
- Fire Prevention Outreach: Number of community members engaged through fire prevention outreach efforts or number of community fire prevention trainings held.
- Expenditure on Fire Services: Total fire/EMS personnel and operations expenditure.
- Fire Travel Time: Average travel time to emergency calls (from dispatch to arrival).
Interested in learning more? Click here to download our complete guide on developing performance measures for local government, including other departments such as police, library, public works, economic development, finance, and more