In an effort to build trust and transparency with their communities, more and more local governments are looking to ensure that the policy and budgeting decisions they make are driven by data, and that organizational performance results are shared with residents. Part of this process involves working with specific departments to develop meaningful and relevant performance measures that help judge current progress against desired outcomes.
In a series of blog posts, of which this is first, we’ll be exploring best practice approaches to identifying key metrics and subsequently, the most common departmental performance measures for local governments.
With communities across North America grappling with issues of racial inequality and social justice, increased attention is being paid to police department performance measures as well as the success of community safety initiatives. Some of these initiatives, such as the groundbreaking work being done in Tempe, Arizona, illustrate that performance measurement and management programs can be applied effectively to public safety reform, while others focus more heavily on measuring traditional key performance metrics associated with police departments.
Given that police departments undergo a broad spectrum of work inside our communities, and that the needs of each of these communities is different, it would be impossible to recommend a “one-size-fits-all” approach to developing performance measures for police departments. However, to provide ideas and concrete examples of relevant metrics for police departments, we analyzed our database of over ten thousand performance measures, drawn from a group of over a hundred local government organizations, to find some of the most commonly used performance measures for police departments in North America.
Below, we’ll look at the top 5 most commonly used metrics based on our local government customers and provide examples as to how police departments are measuring them. We hope you find it valuable in developing your own performance measures!
- Police Response Times: Average length of time it takes for police to arrive after a top priority call is received – measured in minutes and seconds.
Here is an example how the City of Scottsdale, Arizona, charts this metric on their public-facing quarterly performance report:

- Crime Rate: Number of reported crimes. In our data, this is either measured per 1,000 residents or per 100,000 residents, quarterly or annually. This is commonly split out by violent crime and property crime.
Here is an example of how the City of Rowlett, Texas, tracks and charts this data in their strategic plan dashboard:
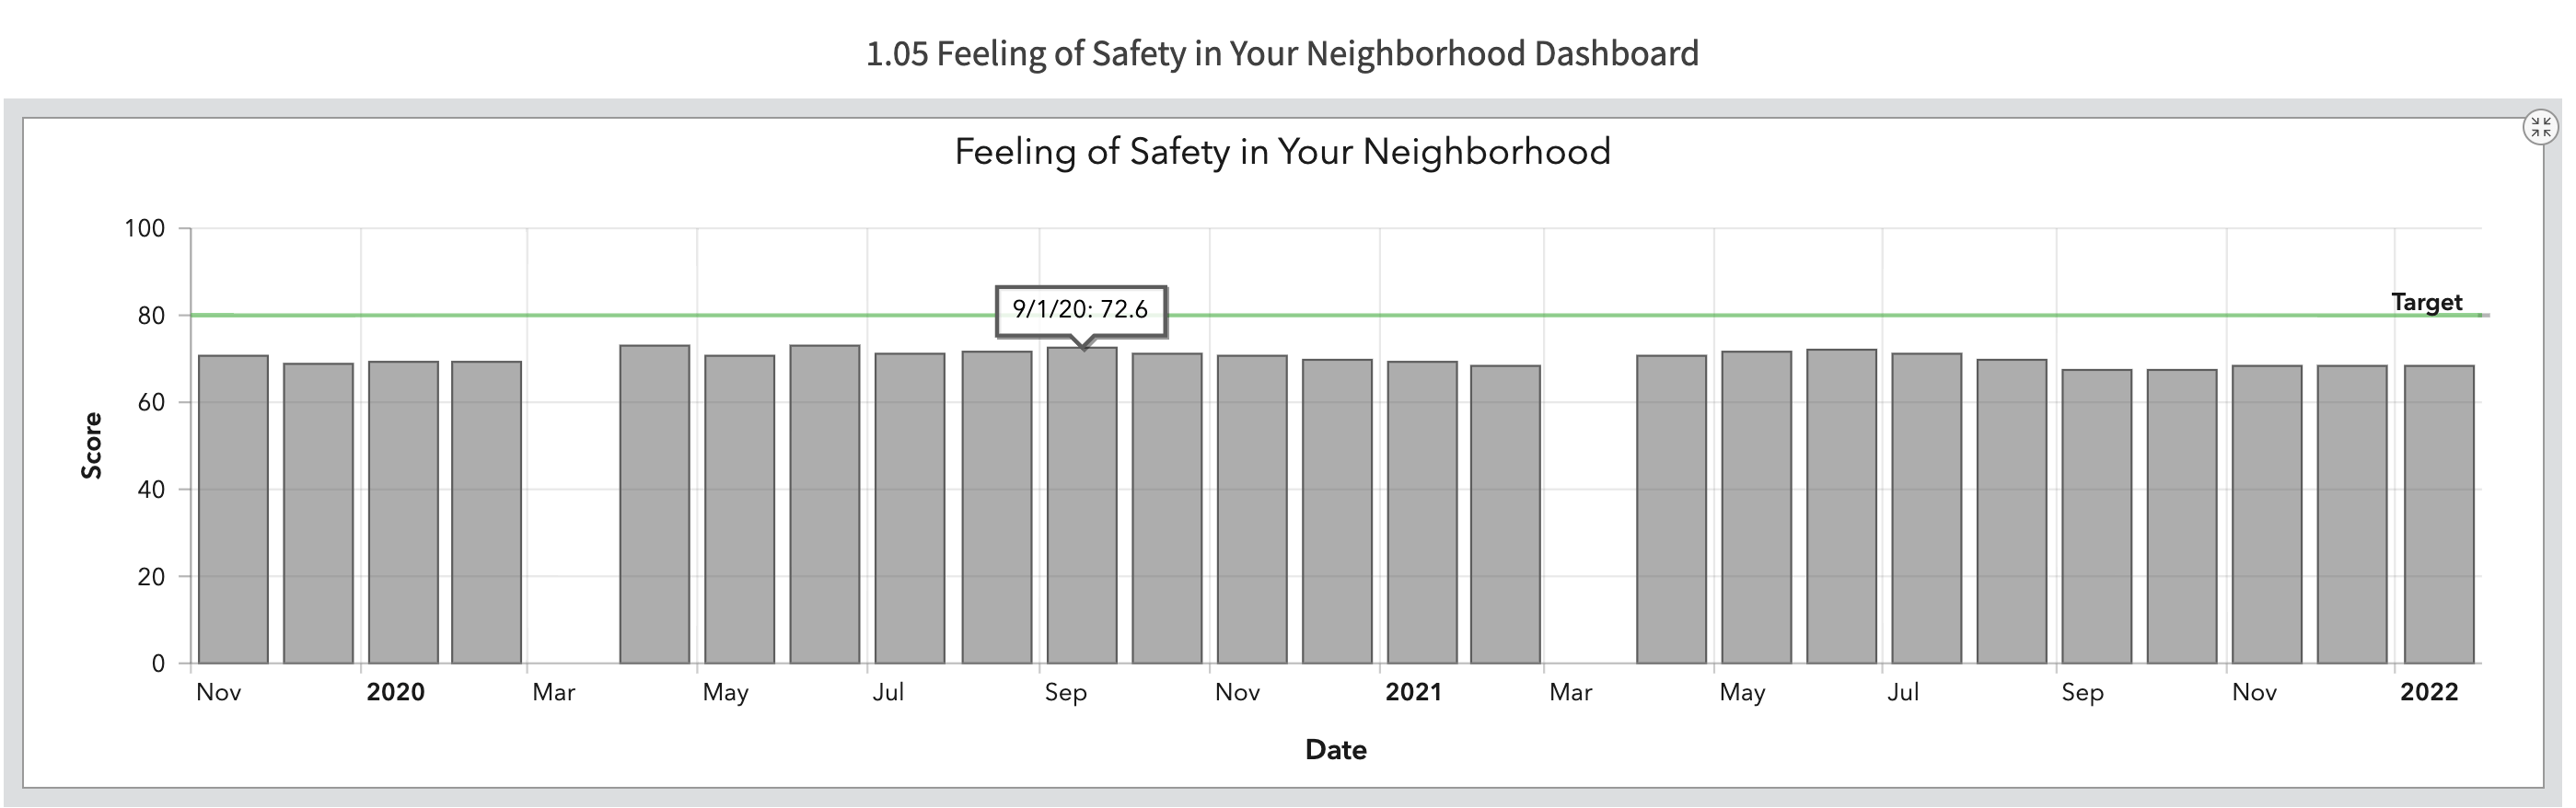
- Feelings of Safety (Community Survey): Usually a percentage of residents who report that they feel safe within their neighborhood. This is measured by community surveys conducted usually annually or bi-annually.
The City of Tempe, Arizona, actually tracks this data monthly. Here’s how they visualize results in their community safety strategic plan dashboard:
- Number of Calls for Police Services: Often measured as calls dispatched per resident and sometimes broken out by officer-initiated or resident-initiated.
The City of Woodbury, Minnesota, tracks this data annually. Here is how Woodbury visualizes the number of calls for police against an annual target, taken from the city’s performance measurement dashboard:
- Crime Clearance Rate: Percentage of crimes cleared. These metrics are sometimes split out by violent and non-violent crimes.
Here is how the City of Tempe, Arizona charts violent cases clearance data in their community safety strategic plan dashboard:


Other common police performance measures that we found in our database include:
- Resident satisfaction with the police
- Time to answer 911 calls
- Number of community events held by the police department
- Percentage of minority employees in the police department
Interested in learning more? Click here to view our interactive demo dashboard for police departments, or download our complete guide on developing performance measures for local governments, including other departmental examples such as fire, finance, parks & recreation, and more.