Contents
When managing publicly funded projects, success is typically determined by whether they are completed on time and within budget, as well as how well community expectations are managed along the way.
This is no small feat. Effectively managing resources—time, people, and budget—while staying on top of communicating progress, risks, and roadblocks can seem insurmountable.
And the evidence certainly suggests there is room for improvement. To quote directly from this recent article in the Washington Post: “Decades ago, Oxford University professor Bent Flyvbjerg sought to find out how often major infrastructure projects were completed on time and on budget. He found no one kept track, so he created his own database. What he discovered wasn’t pretty: The vast majority of megaprojects — those with a value of at least $1 billion — did not meet their budget or deadline.”
Let’s face it: if you’re not hitting your deadline, there’s a high probability you’re also over budget because every day not completing your project costs money.
Investing in the right tools to manage complex, but critical, public projects is one of the keys to success.
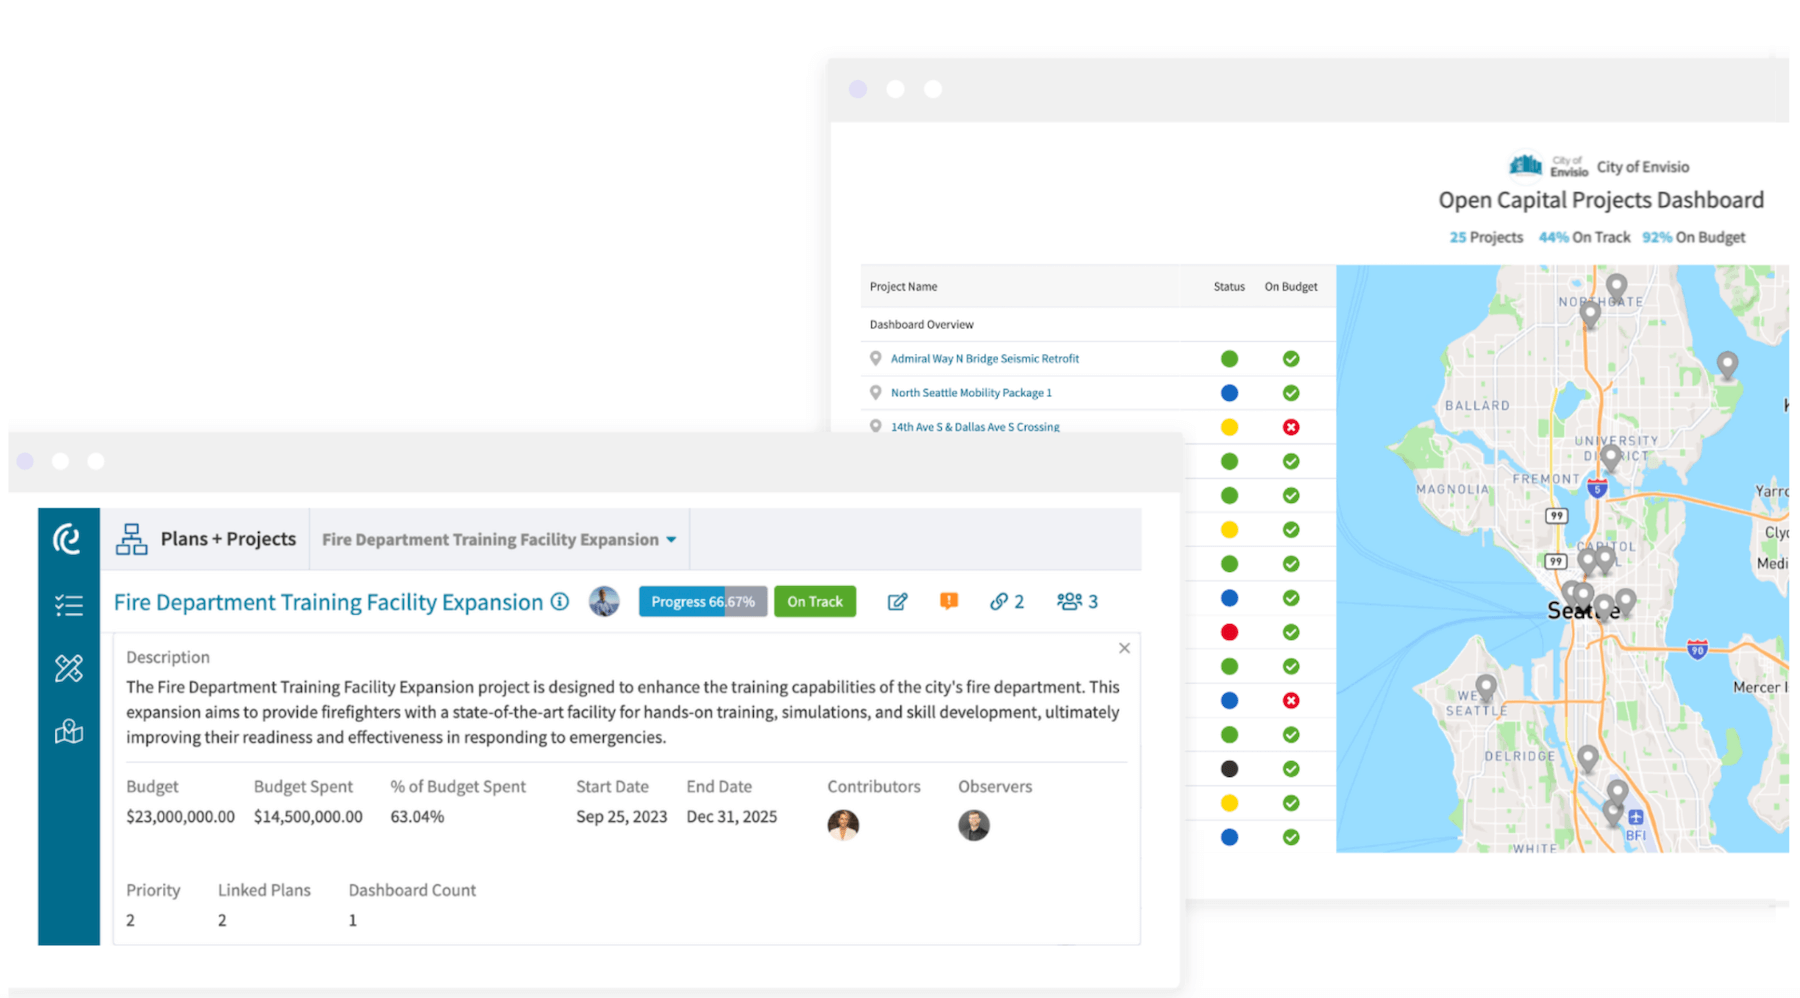
Envisio Projects, released in November 2023, is here to help. Projects is built specifically for the public sector to help address what matters most for publicly funded and publicly accountable organizations: visibility, collaboration, and transparent communication.
And with today’s newly released features, you can further improve your ability to manage timelines and report on progress.
Let’s break down the new features and enhancements…
Envisio Projects now includes:
- Interactive Gantt chart enhancements for improved visibility and productivity
- OpenAPI to integrate data from other systems such as your budgeting software
- Project summary reports for easier, more transparent communication
Your projects delivered on time with improved interactive Gantt Chart visibility and management
We know Gantt charts are critical to getting visibility into project management and ensuring things get done on time. It’s important to have the ability to visualize project timelines and see a snapshot of status to understand the big picture across the organization–this is especially true when juggling multiple projects per year, and managing multi-year timelines. Without visibility of timelines, dependencies, and your most important resource—people—you’re operating in the dark.
Let us help you turn on the lights…
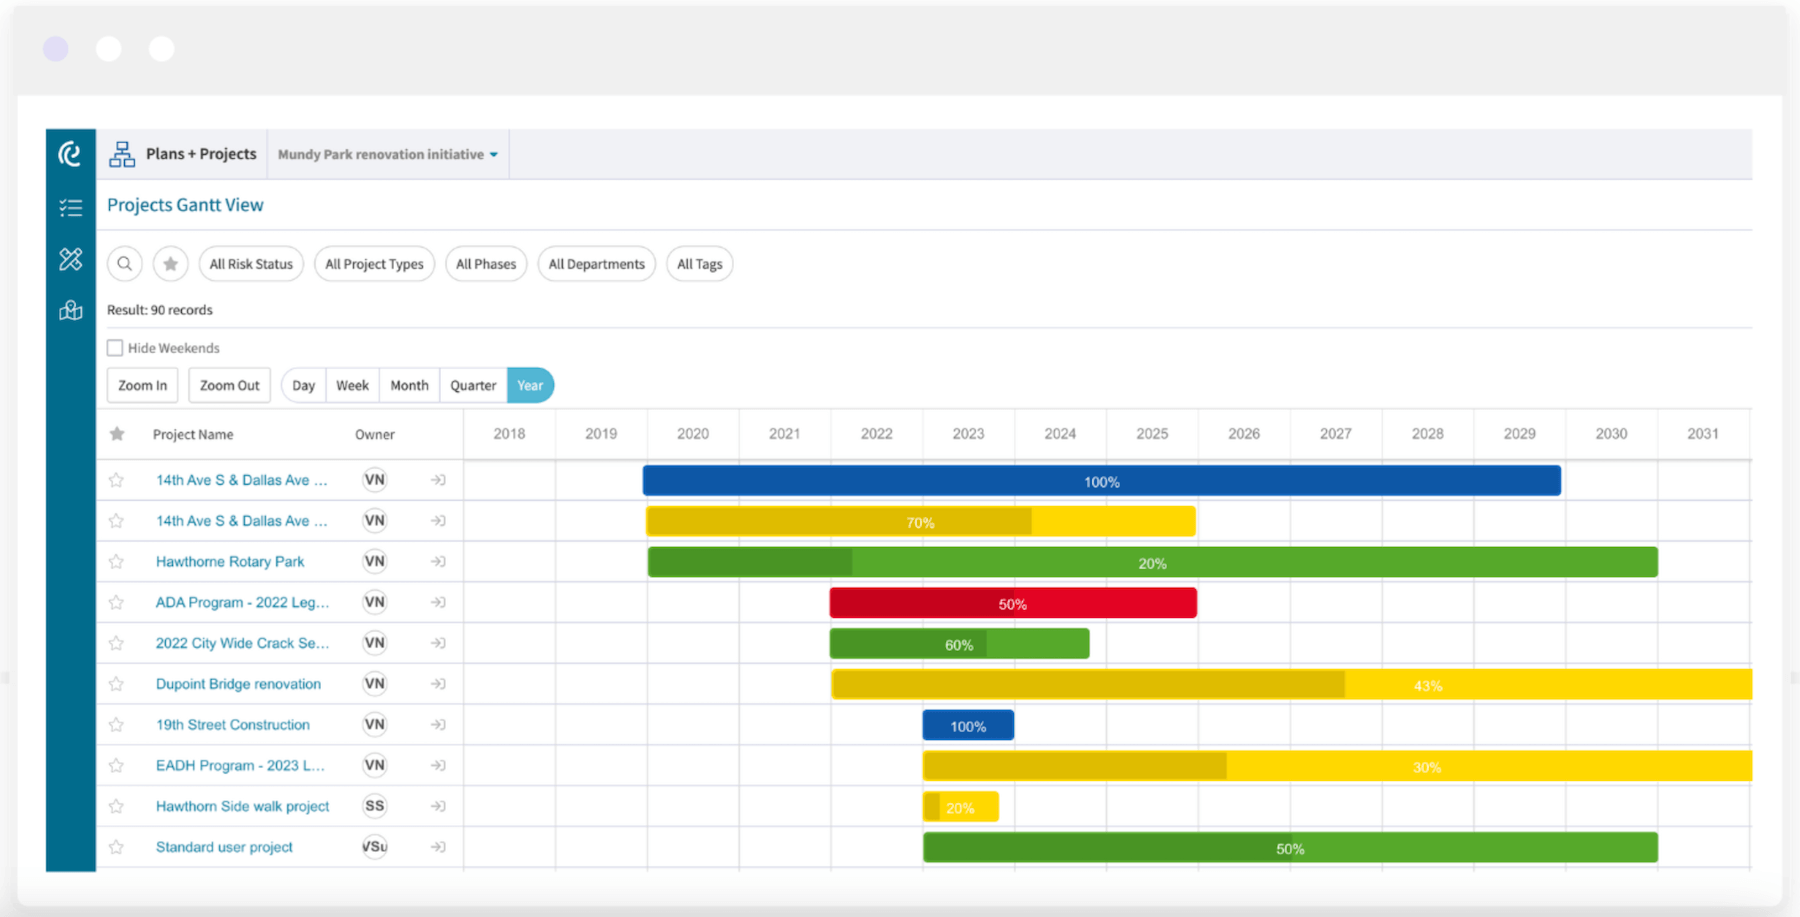
Advanced Gantt filtering
Our latest feature enhancement focuses on improving productivity using our interactive Gantt charts. When looking across all projects, you can now filter information to show customized views. For example, as a Director or Project Manager, you may want to configure the Gantt chart to only show projects with ‘some disruption’ risk status within the ‘plan and design’ phase, and within a single department. This view can then be downloaded as a CSV, image, or PDF to be used in meetings, presentations, or as a snapshot overview to support discussions in identifying issues or conflicts early.
Multi-project visibility
In addition, you can now easily view multiple projects and tasks at a bird’s eye view with the ‘zoom in’ or ‘zoom out’ feature, or toggle between day, month, quarter or year to give you the short to long-range project plan and better manage overlapping timelines and resources.
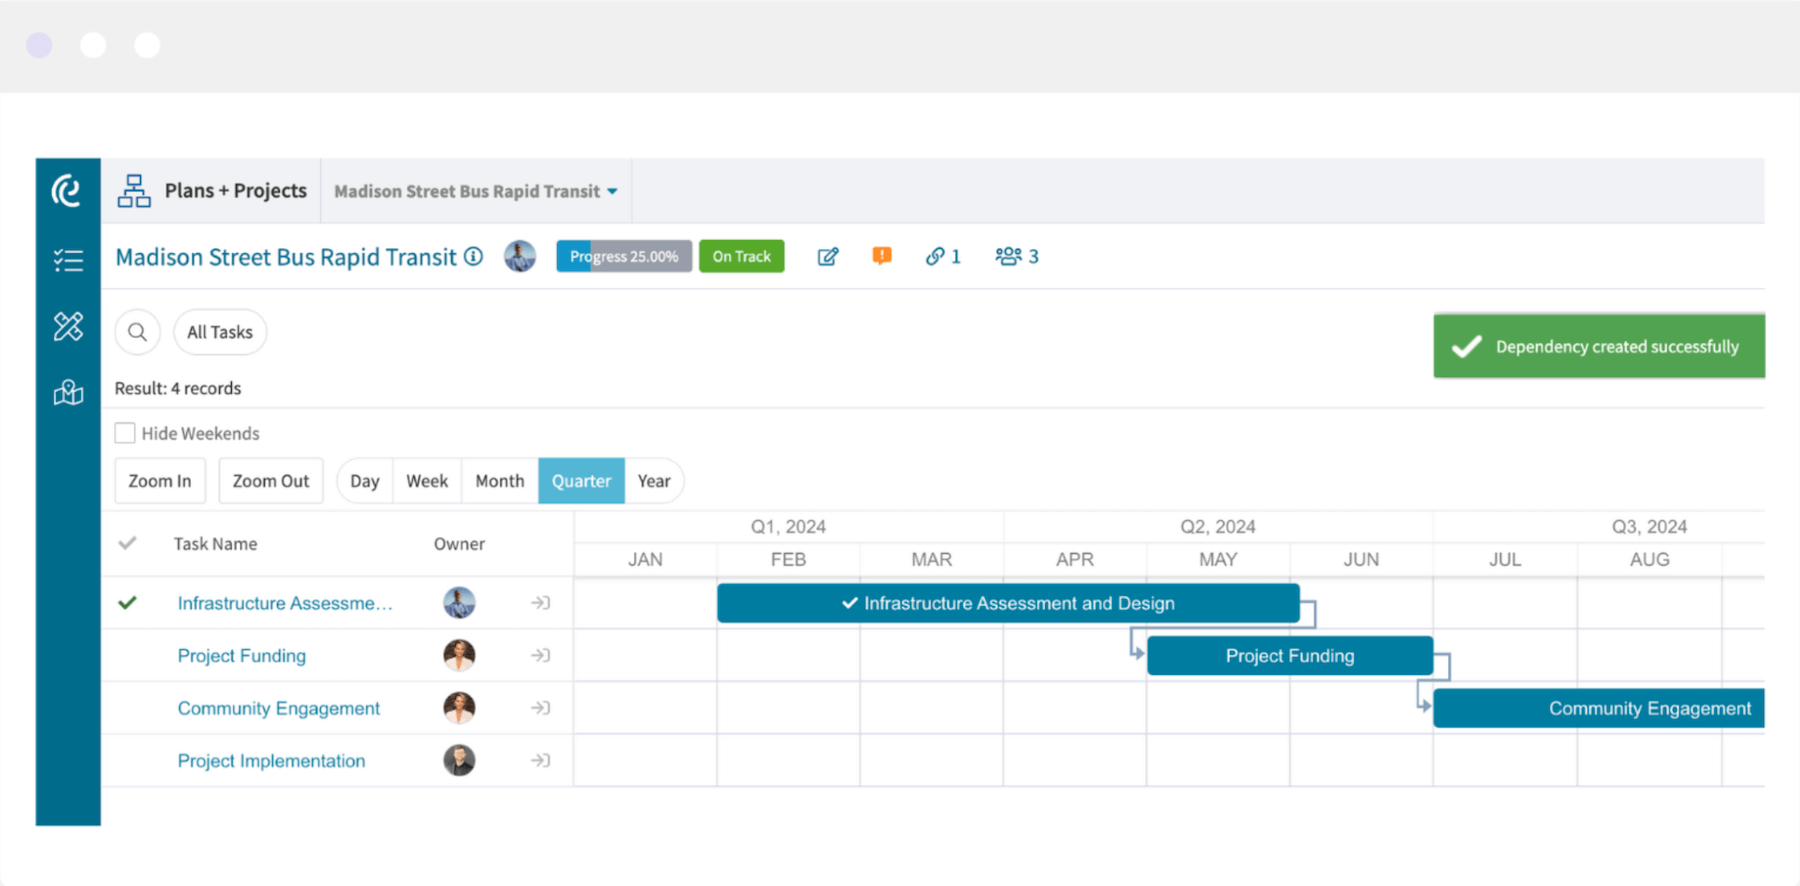
Drag-and-drop task management
Now to the exciting part: the productivity power that comes into the interactive Gantt when working within tasks. Envisio’s task management allows an unlimited number of tasks or sub-tasks, start and end dates, and easy collaboration with the ability to assign owners and observers. Tasks are weighted into the project progress percentage, ensuring your progress is always accurate. Now, with this enhanced functionality, you can update timelines with a simple drag-and-drop interface and create or delete dependencies. All updates are auto-reflected in the task and auto-sorted by start date to save you time and keep you organized.
The interactive Gantt chart is about visually understanding task interdependence and timeframes, enabling you to easily make the necessary changes while looking at the big picture.
Your budget data auto-updated to project snapshots with OpenAPI
Some of the biggest challenges of managing large-scale projects come down to working within different systems; keeping information siloed, creating manual work, or having incorrect or outdated information.
Let’s use budgeting software as an example.
Using our OpenAPI, Envisio Projects can now pull data from budgeting systems to show up-to-date ‘budget’ and ‘budget spent’ and then auto-calculate the ‘percentage of the budget spent’.
This can provide a powerful summary when reviewed alongside the project progress percentage to ensure the budget is on track. This summary data, which can be updated within Envisio on a frequency of your choosing, can be used in internal project snapshots, reports, and external project dashboards to showcase budget transparency and identify risks and solutions.
Managing expectations with project summary reports
Now that we’ve got a handle on managing time and budget, we can move to managing expectations. At Envisio, we are big believers in the power of reporting; our reporting capabilities run deep to meet the needs of different users and audiences. Envisio Projects integrates with Envisio Plans to leverage the full power of Envisio’s reporting capabilities, but we also recognize that sometimes less is more.
With the new Project Summary Report you can generate a PDF overview of any project with one click. These progress reports can be used among project teams to mitigate delays and cost overruns or shared with elected officials to foster transparent communication and gain a shared understanding of priorities.
Ultimately, our goal is a positive perception of local government and the work being done.
Trust comes from doing what you say you’re going to do when you say you’re going to do it.
Large-scale projects (think bridges, airports, roads, and subways) impact residents daily. Getting them done on time, within budget, and with regular communication along the way helps to build trust and community pride.
Get started ↓
Want to learn more about Envisio Projects? Check out these resources!
Article: Elevate Your Capital Improvement Plan with Envisio’s New Project Management Features
Webpage: Manage, Deliver, and Communicate Capital Improvement Projects
Webinar: Introducing Envisio Projects: Centralizing Capital Improvement Project Management
Comparison Matrix: At-A-Glance Features of Envisio Projects
And, of course, you can see Envisio and our new Projects enhancements for yourself! Book a demo and let us show you around.