
Contents
- Moving from Housing Strategy to Implementation in 2026
- Real Housing Strategy 1: Measuring Implementation Using a Housing Strategy Toolkit (Denton, TX)
- Real Housing Strategy 2: Tracking Detailed Housing Actions (West Hollywood, CA)
- Real Housing Strategy 3: Using Supply, Subsidy, and Stability as Measurement Lenses (Rockville, MD)
- Real Housing Strategy 4: Combining Outcome Metrics With Demand Indicators (Montgomery County, MD)
- What Does Effective Housing Strategy Measurement Look Like?
- Using Housing Metrics to Support Better Housing Strategy Outcomes
Summary
This article explores how cities track housing strategy progress using outcome-focused metrics, public dashboards, and transparent reporting. Real-world examples show how effective measurement supports better decisions without oversimplifying complex housing systems.
- Housing strategies require metrics that reflect complexity, not single headline numbers
- Effective frameworks track both implementation and outcomes over time
- Public dashboards improve transparency, trust, and cross-department coordination
- Combining outcome metrics with demand indicators shows progress in context
Housing strategies are among the most complex policy initiatives cities undertake. They typically require long time horizons, multiple departments, layered funding sources, and political scrutiny.
Housing problems – from affordability to supply to homelessness to infill development – defy simple solutions or single-number metrics. Measuring progress in this environment is as challenging as it is essential.
“Housing” is a great example of a “wicked problem”. Wicked problems need multi-faceted solutions, and importantly, performance measures.
Of course, effective performance measurement is not always simple.
Local government leaders working on housing policy and strategy need metrics that capture complexity, while also providing clear insights into performance.
Cities that rely on a narrow set of indicators risk missing critical housing signals. Cities that avoid measurement altogether struggle to communicate progress.
The most effective housing strategies find a middle ground. They are intentional about what they measure, without compromising the complexity of housing systems.
Let’s examine common housing strategy pitfalls in 2026, alongside effective examples that balance breadth with clear, measurable progress.
All examples used in this blog are supported by Envisio’s strategy software, to help track progress, measure performance and transparently share results.
Moving from Housing Strategy to Implementation in 2026
What gets measured gets done.
Moving from strategy to action requires clarity about what is being delivered, when, and how that progress will be assessed. This means, measurement plays a critical role in bridging this gap—connecting long-term housing goals to concrete implementation steps and observable outcomes.
Public policy changes can take a while to be implemented, and this is particularly true for housing strategies. And when it comes to housing strategies, there is no one-size-fits-all metric.
Effective Housing Strategy Measurement
Focusing on a single figure – like the number of new affordable units built – can overlook many other critical dimensions such as housing quality, accessibility, or the preservation of existing affordable homes.
Housing outcomes do not respond quickly to policy changes. A zoning amendment today may not produce new units for years. A rental assistance program may stabilize households immediately but leave supply constraints unresolved.
For this reason, housing strategy metrics should track both implementation and outcomes.
Effective measurement frameworks for housing strategies typically include:
- Policy and program implementation milestones
- Production and preservation indicators
- Demand and access indicators
- Stability and displacement measures
Let’s go a little deeper into pitfalls to avoid and examples of success.
3 Common Pitfalls in Housing Progress Tracking
1. Relying on Only Narrow or Single-Dimension Metrics
Tracking only unit counts or funding totals creates blind spots. Unit production alone does not show who benefits, where housing is located, or how stability changes over time.
For instance, research advocates for those experiencing homelessness suggest using both:
- Program Performance Indicators — which differ depending on who a program serves, what it aims to achieve, and how services are delivered. These indicators help evaluate how individual programs are performing. They allow for comparison among similar programs.
- System Performance Indicators — which capture performance at a broader level. They measure collective impact across the homeless-serving system, tracking progress toward shared, system-wide goals.
Takeaway: Cities benefit from using a set of housing strategy metrics. For ex: units produced or preserved, rent burden, vacancy rates, waitlist lengths, and program participation.
2. Tracking More Program Activity than Program Outcomes
Yes, we just told you to not get too narrow.
But don’t go the other way and become too broad!
Cities need clear housing outcome measures—not just activity tracking—to understand real impact.
Pairing outputs (what was done) with outcomes (what changed) helps assess affordability, access, and housing stability.
Takeaway: Outcomes are essential for understanding impact and guiding course correction.
3. Treating Housing Reporting as an Annual Exercise
Annual reports support formal accountability. They are not well suited for managing complex housing strategies. Housing conditions, development timelines, and funding environments change faster than annual reporting cycles allow.
Takeaway: Consistent, frequent reporting improves coordination across departments and partners by grounding decisions in current, shared data.
Real Housing Strategy 1: Measuring Implementation Using a Housing Strategy Toolkit (Denton, TX)
The City of Denton, Texas, adopted an Affordable Housing Strategic Toolkit built around five strategy areas, including zoning reform, preservation, and information access. Each strategy includes multiple targeted actions.
Rather than summarizing progress with a single headline metric, Denton tracks:
- Cumulative implementation over time
- Progress by strategy area
- Completion status of individual toolkit actions
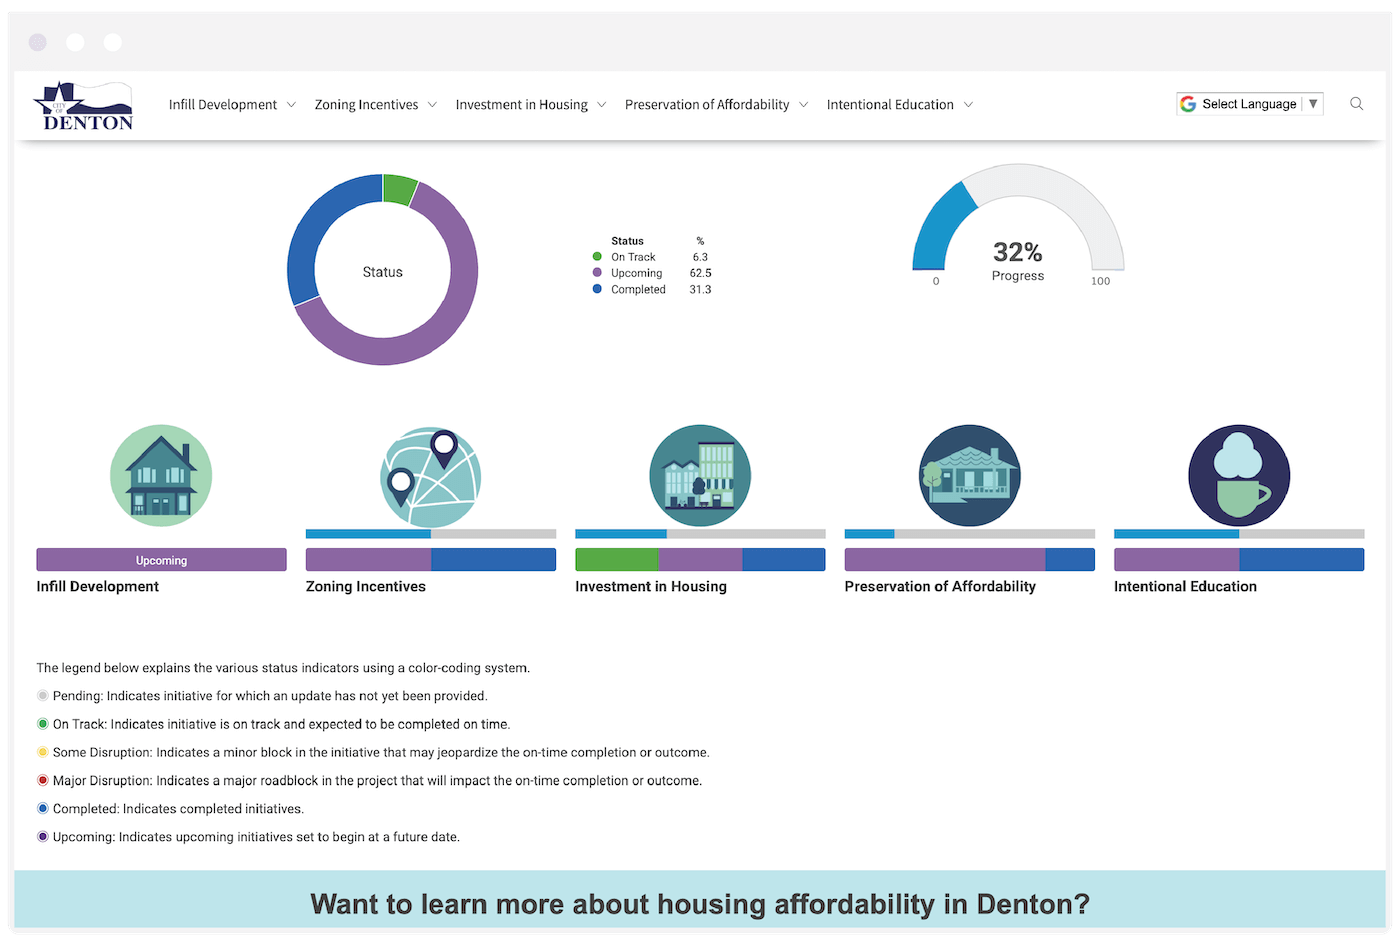
This approach treats housing strategy as a portfolio of actions that advance at different speeds. Public reporting shows which initiatives are complete, and which require additional effort.
The result is clarity without oversimplification.
Real Housing Strategy 2: Tracking Detailed Housing Actions (West Hollywood, CA)
The City of West Hollywood’s public dashboard is one of the most detailed housing implementation dashboards in North America.
The city’s Housing Element includes:
- State-mandated production targets by income level
- Six major housing goals
- More than 100 individual actions and programs
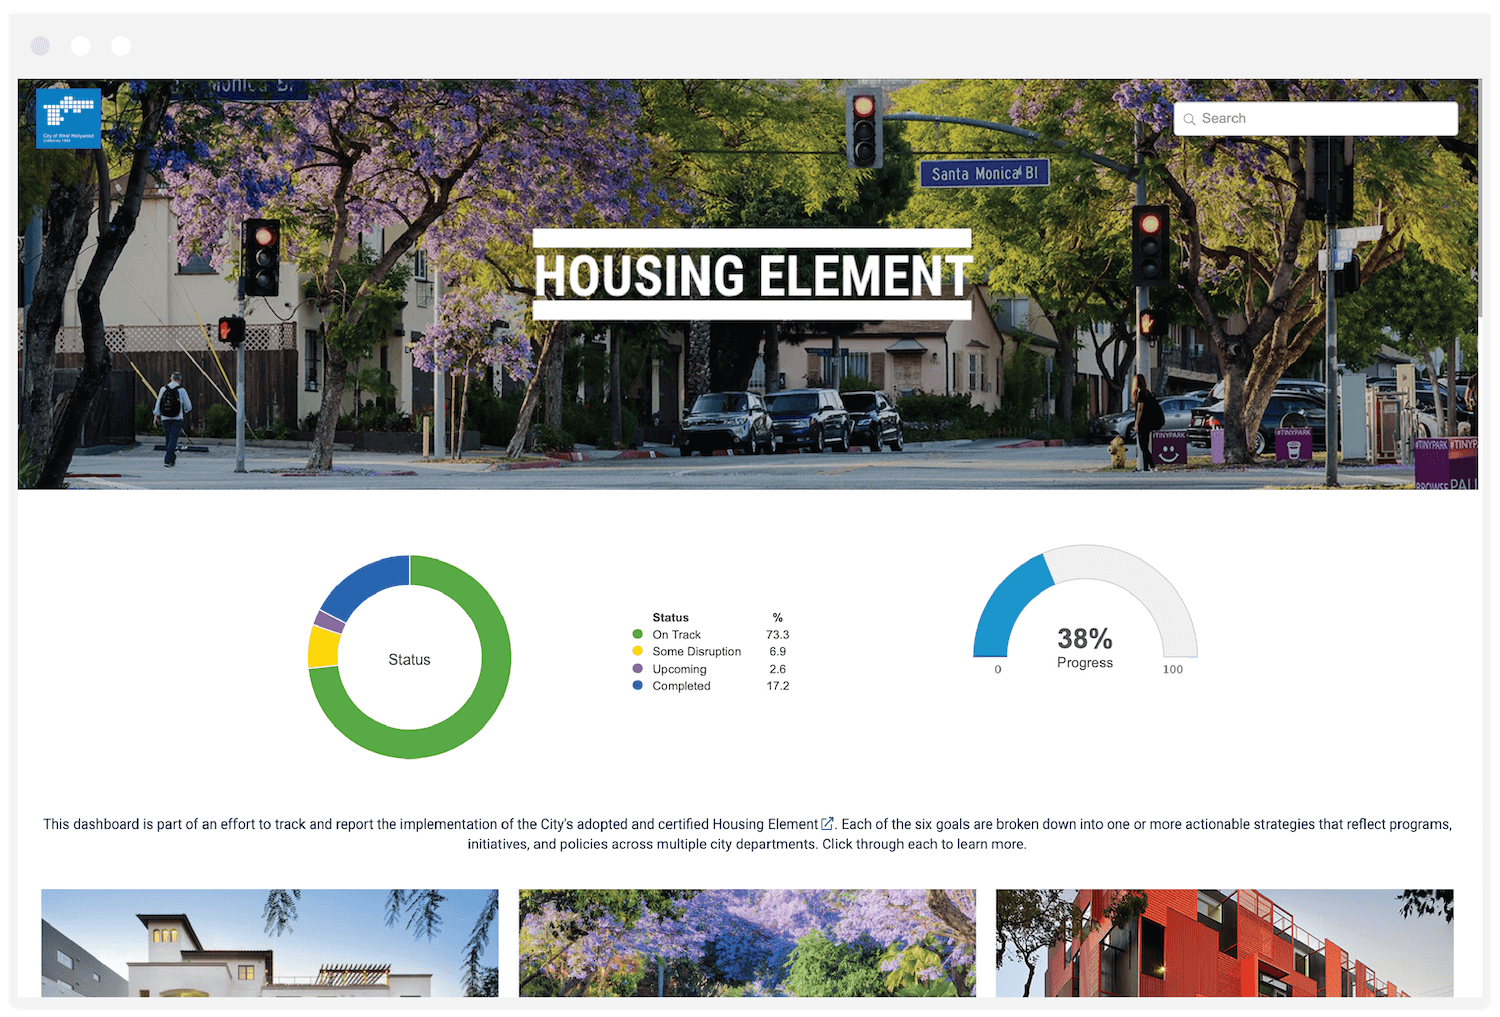
Progress tracking reflects this structure. Metrics include:
- Action-level implementation status
- Affordable housing production by income category
-
Policy adoption milestones tied to state requirements
By reporting at this level, West Hollywood avoids reducing housing progress to unit counts alone.
It shows regulatory reform, preservation, tenant protections, and incentives alongside housing production.
Real Housing Strategy 3: Using Supply, Subsidy, and Stability as Measurement Lenses (Rockville, MD)
The City of Rockville, Maryland’s housing dashboard organizes strategy around three lenses: supply, subsidy, and stability.
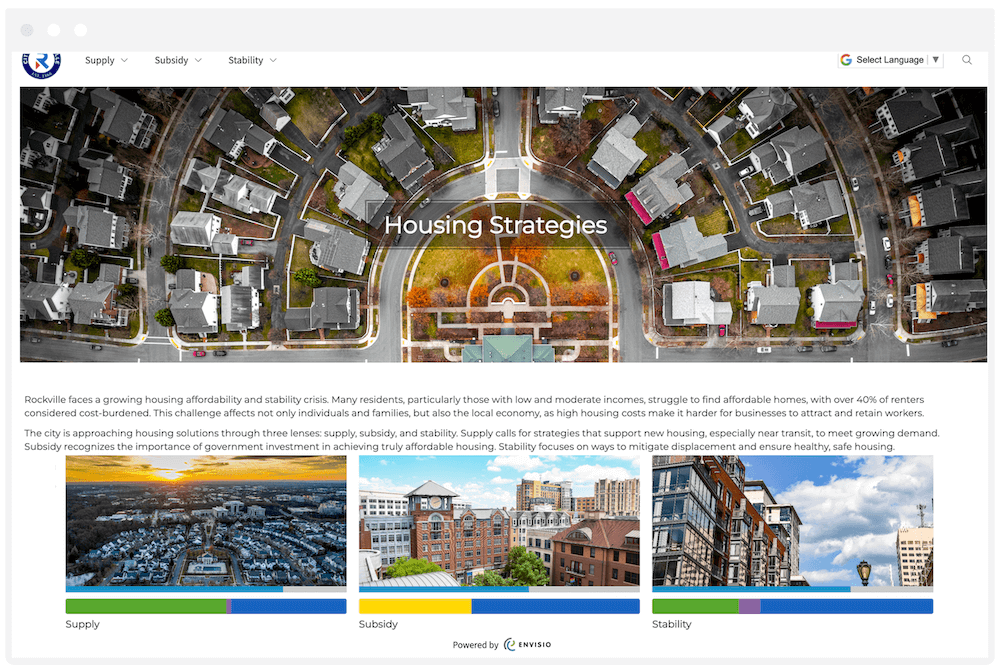
Each lens has distinct measures:
- Supply metrics track new housing approvals, zoning changes, and development incentives
- Subsidy metrics track funding allocations and affordability supports
-
Stability metrics track preservation efforts and resident protections
This structure allows the city to identify imbalances early. Progress in one area does not mask stagnation in another. Reporting reinforces that housing outcomes depend on coordinated progress across all three lenses.
We especially love Rockville’s homeownership assistance program! Rockville’s approach reflects an outcome-oriented housing strategy focused on expanding homeownership access. This supports workforce retention and fosters long-term community stability.
Real Housing Strategy 4: Combining Outcome Metrics With Demand Indicators (Montgomery County, MD)
Montgomery County, Maryland uses a public, data-rich housing dashboard to track progress on its five-year affordable housing strategy.
Instead of a single completion metric, the dashboard combines outcome measures with demand indicators.
These include affordable unit totals, year-over-year growth, and housing assistance waitlist size.
These include affordable unit totals, annual growth, and housing assistance waitlist size.
By pairing production metrics with demand data, Montgomery County gains a more grounded view of housing conditions.
Key measures include:
Size of housing assistance waitlists
- Total affordable housing units
- Net change in units year over year
- Progress toward strategic housing goals
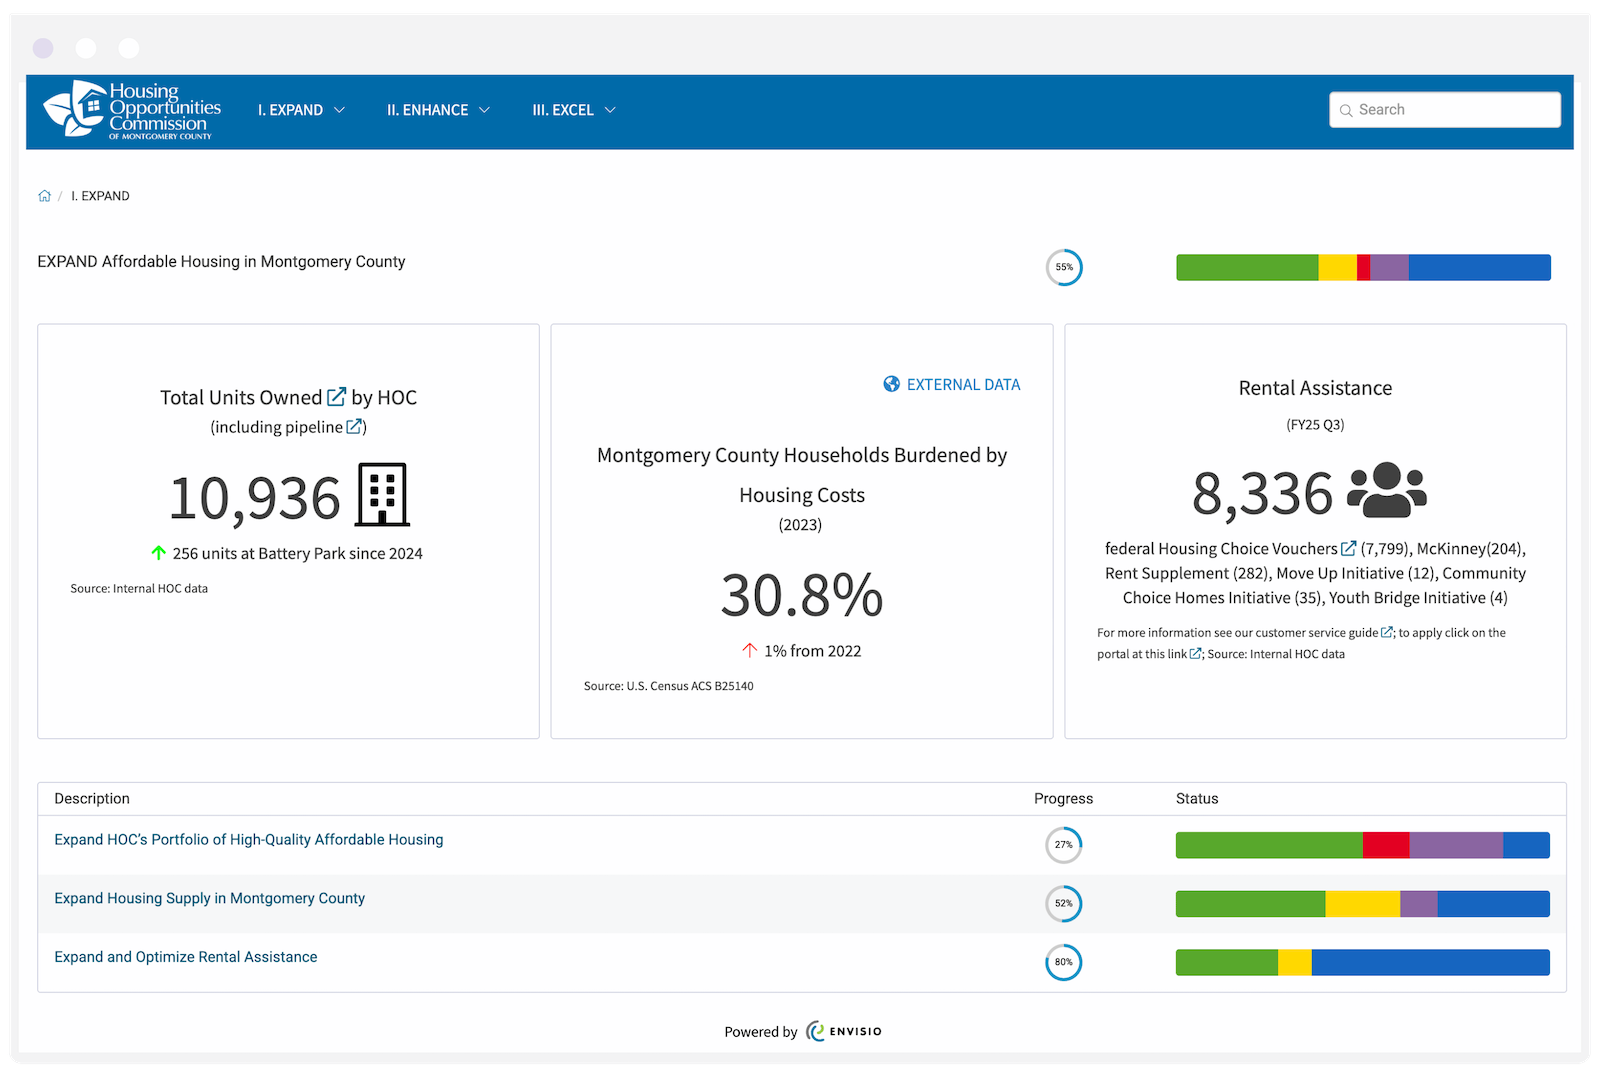
Balancing outcomes and demand helps housing strategies remain responsive, transparent, and focused on real community need.
What Does Effective Housing Strategy Measurement Look Like?
Effective housing measurement systems support better decision-making and clearer public reporting.
They help leaders assess policy implementation, identify meaningful change, and determine where adjustments are needed over time.
These four housing measurement systems share several defining characteristics:
1. Metrics Are Anchored to Strategy and Policy Intent
Effective housing measures align directly with adopted goals, policy commitments, and long-term priorities.
They reflect community priorities, not just departmental outputs. Strategic alignment helps leaders assess progress and evaluate tradeoffs across competing goals.
2. Measurement Reflects the Full Housing System
Housing strategies span interconnected dimensions. Supply, affordability, access, and stability influence one another and should be measured together. Parallel tracking reveals system-level performance and prevents isolated gains from masking emerging risks.
3. Measures Distinguish Implementation From Outcomes
Strong frameworks separate action from impact. Implementation metrics track policies and investments. Outcome metrics track changes in housing conditions over time. Together, they help leaders assess effectiveness and adjust course.
4. Data Is Public, Contextual, and Understandable
Effective housing measurement prioritizes transparency and clarity. Clear definitions, targets, and context help data inform decisions without creating confusion or false certainty.
Using Housing Metrics to Support Better Housing Strategy Outcomes
Housing strategies require patience, coordination, and sustained attention. Measuring progress requires the same qualities.
Cities like Denton, West Hollywood, Rockville, and Montgomery County show housing progress can be tracked without flattening complexity. They demonstrate how housing strategy metrics, when designed thoughtfully and shared transparently, support trust, learning, and results.
For public sector leaders, the lesson is clear: measure what matters, share what you learn, and use data to guide decisions.