For the final entry in our Measure What Matters series, we’ll be examining common Public Works performance measures to gain a better understanding of what data-savvy local governments are measuring, and why that’s important.
Public Works departments are responsible for a broad spectrum of assets and services within a community. Broadly defined, they build and maintain critical infrastructure and public services to keep the community safe and thriving.
Areas of Public Works responsibility typically include transportation, sanitation, municipal engineering, utilities, fleet management, and public buildings management. This could include things like schools and hospitals as well as critical infrastructure such as roads, bridges, pipelines, and even airports! Public Works departments can also be responsible for public spaces not under the purview of Parks & Recreation. It’s safe to say that few cities could function without someone diligently managing all these responsibilities.
With such a broad remit, Public Works is arguably the department that has the most things that it could measure in an effort to track, improve, and communicate performance.
But what performance measures should Public Works be using?
To help, we’ve analyzed our database of over ten thousand performance measures, drawn from a group of over a hundred local government organizations, and in doing so have identified some KPIs that are common in Public Works departments.
It is important to note, however, that this is the department where we found least commonality in performance measures between the various cities and counties that make up Envisio’s customer base. We have done a deeper dive on the top 5 most commonly used measures below, as well as provided examples on some of the many others we found.
We’re providing them in order to give you concrete examples of what others are measuring. We hope you find them valuable for your own performance management initiatives.
- Amount of Recycling Collected: Total amount of recycling collected. In tons or pounds, measured monthly, quarterly, or annually.
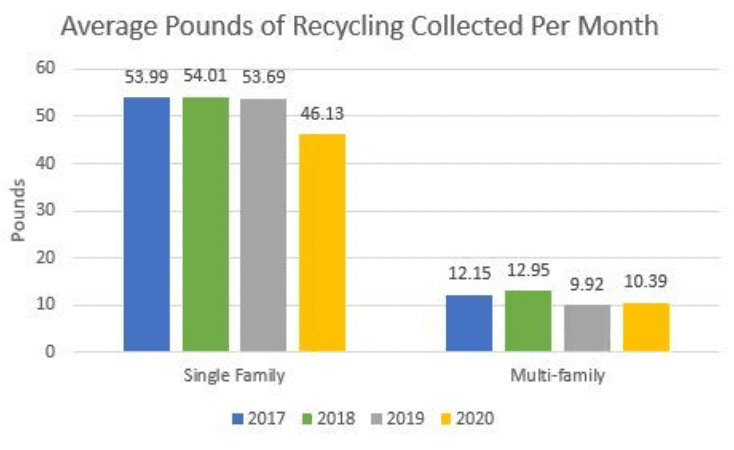
The City of Maplewood, Minnesota, measures the average pounds of recycling collected per month and splits this out between single family homes and multi-family homes. The city reports these results via their Strategic Plan Performance Measurement dashboard. The goal is to increase residential recycling and decrease trash:

- Quality of Street Maintenance: Typically measured as the average Pavement Condition Index (PCI) of streets. Sometimes broken out into residential and non-residential streets. In some cases, this is a measure of the level of resident satisfaction in the cleanliness of streets. This is measured by community surveys conducted either annually or bi-annually.
The City of Minnetonka, Minnesota, measures the level of community satisfaction with street maintenance annually and reports results via their Strategic Profile & Community Dashboard:

This interactive bar chart shows what percentage of residents surveyed rated street maintenance as Poor, Fair, Good or Excellent:

- Water Usage: Measured either as gallons of drinking water produced daily or residential per capita water usage (gallons per day).
The City of Woodbury, Minnesota, measures the latter. They report results annually via their public-facing Performance Measures Dashboard, together with their desired performance goal:

- Water Loss: Percentage of lost and unaccounted for water. This is the difference between measured water produced and measured water delivered. Measured quarterly or annually.
The City of Scottsdale, Arizona, measures the percent of lost and unaccounted for water quarterly. They visualize this data, along with how well they are doing against target, as part of their public-facing Quarterly Performance Report:

- Fleet Availability: Sometimes broken out by public safety and non-public safety. Measured monthly, quarterly or annually.
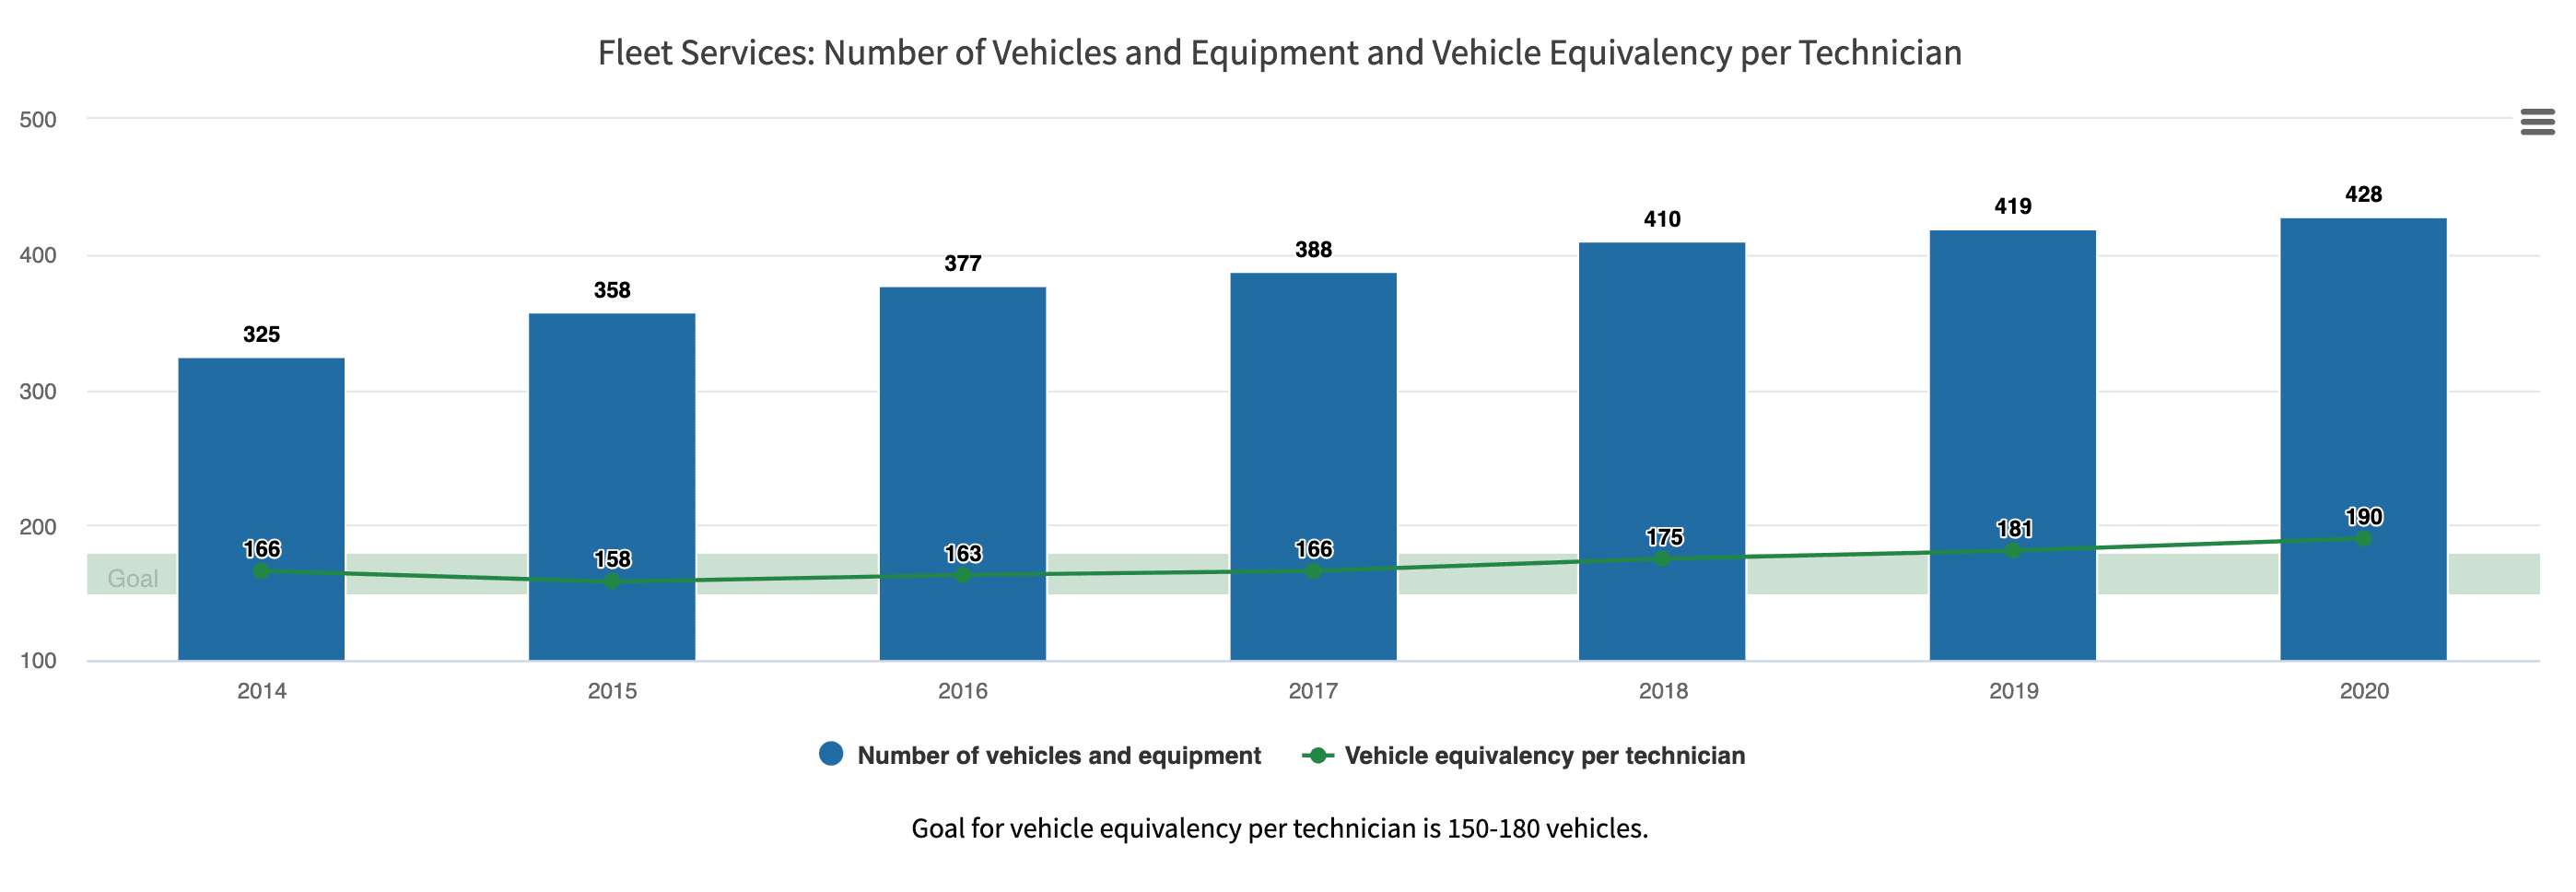
The City of Woodbury, Minnesota, tracks fleet availability data annually. Here is how Woodbury visualizes the total number of vehicles and equipment per year, as well as the vehicle equivalency per technician, in a single chart:

Other common Public Works department performance measures that we found in our database include:
- Amount of Water Mains: Total number of miles or feet of water mains.
- Amount of Sewer Mains: Total number of miles or feet of sewer mains.
- Number of Valves: Number of water valves, usually measured annually.
- Fleet Maintenance Costs: Total cost, measured annually.
Interested in learning more? Download our guide on developing performance measures for local government, including other departments such as police, library, fire, parks & recreation, and more.


