Contents
Summary
This blog offers a clear, modern approach to measuring government performance. It breaks down how to choose meaningful performance measures, explains the difference between KPIs and broader metrics, and gives 50 practical examples cities and counties can use to track progress and improve services.
Key takeaways:
- Measure inputs, outputs, and outcomes to understand real impact.
- Keep your metrics focused on community priorities.
- Don’t track everything. Track what helps you make better decisions.
- Review and refine your measures regularly to stay aligned with local needs.
Measuring Municipal Government Performance: Developing Modern Performance Measures
Developing key performance measures in government is an essential part of strategic plan implementation, effective service delivery, the successful roll-out of new initiatives, and ensuring the core functions of local government are running smoothly. When scoped correctly, performance measures can be the compass that guides your local government towards large-scale strategic accomplishments and positive community outcomes. This work is fundamentally about measuring government performance in ways that matter to residents.
Performance measurement in local government ought to include measuring program activities or successes (sometimes called output measures), the resources used in any given effort (the inputs), and the outcomes of an effort or plan. Performance measurement is a best practice that should be used in every local government department.
Municipalities are under a lot of pressure to get things done quickly and correctly, while trying to serve a wide range of people, often with conflicting needs and interests. Doing something efficiently, but not effectively, can have disastrous results in the public sector—and doing something effectively, but not scoped realistically enough or broken down enough over time—can risk urgent changes taking way too long. Having meaningful metrics that measure progress towards specific goals and objectives can ensure your strategies are reaching who they need to reach, and that actions are having their intended effect.
Local Government KPIs vs Performance Measures
Choosing the right things to measure can be a daunting task! The thing is, there are So. Many. Things. To. Measure. It’s easy to get lost and miss seeing the forest for the trees, when you start diving into every single possible key performance measure or key performance indicator (KPI) for every single dimension of local government life.
If we wanted to really make a comprehensive list of every single KPI a local government could measure, this blog post would take a really long time to read (and write) and would not be particularly useful. Instead, this post will explore what we increasingly see as more meaningful and useful measures from across our customer base of more than 150 cities, counties, towns, and special districts.
It’s 2023. Today, we all have a much deeper understanding of the importance of measuring what matters, not just tracking data points for the sake of it. This blog post will provide ideas and suggestions from our local government customer base on what to measure to actually help keep you on track, make decisions, and understand the impact of your work.
Let’s start with understanding our performance measurement definitions, and how they relate to measuring government performance.
In the public sector, when it comes to measuring inputs, outputs, and outcomes, you’ll probably hear both “KPIs” and “performance measures” being used.
Just so we’re all on the same page on what these terms mean:
Key Performance Indicator (KPI) – A quantifiable expression of progress toward a specific strategic goal. KPIs quantify ongoing results of a program, and are typically tightly scoped questions, the answers to which can help us better understand how well something is working. For example, “Length of time it takes for employees to submit reports” is a KPI related to an overall strategic goal of organizational productivity and efficiency.
Performance Measure – A KPI is a performance measure, but not all performance measures are KPIs. Rather, KPIs are a type of performance measurement. Performance measurement refers to the broader, typically numerically quantifiable, practice of measuring and expressing a feature of a particular service or program—such as how effective, efficient, expensive, or how many resources something requires. Performance measurement often includes measuring input/output ratios, and it is typically is used to mean quantifying and evaluating overall activities and processes (usually broken down into KPIs).
All that said, most experts agree that the terminology you use between these two is not as important as ensuring everyone is on the same page! For this blog, because we are looking at performance measurement more broadly, that’s the term we will focus on.
Let’s get started first with our step-by-step guide on how local governments can select those key municipal government performance measures to ensure improved governance and enhanced services. Then, we’ll present 50 top local government performance measures drawn largely from our customer database of more than 150 of North America’s top performing local governments. We’ve spent time analyzing what they’re measuring, and then we’ve divided that up based on theme. There’s five performance measures per theme. And while this list is by no means exhaustive, we hope it gives you some inspiration and ideas to get started!
Five Steps to Getting Started
Step 1: Define Objectives and Goals
Clearly define your objectives and goals, and figure out if you want to be focusing on leading indicators (possible future outcomes), or lagging indicators (looking to past trends and changes, to get a sense of patterns), or a combination of both. Also, your goals should be aligned with your community’s needs and expectations. Goals might include enhancing public safety, or ensuring environmental sustainability: your actions and KPIs should map onto these objectives in a way that is specific, measurable, achievable, relevant, and time-bound (SMART).
Step 2: Identify Data Sources
Determine the data sources available to track progress towards the defined goals. This also doubles as, “Identify the stakeholders involved.” Is this an internal KPI? Or does this particular performance measure concern the community? It may sound like a no-brainer, but knowing who is at stake is a critical part of measuring performance and capturing the right data. This data could include surveys, reports, existing databases, national datasets, or information collected from various departments within your local government organization, providing the foundation for measuring government performance.
Step 3: Keep Purpose Scoped (Avoid Vanity Metrics)
It’s easy to get scattered. Focus on those indicators that directly impact the outcomes, align with the community’s priorities, and tell you a useful story of how the organization or department is performing. Avoid measuring too many KPIs, as it may lead to data overload and distract from the core strategic objectives. (“Wait, why were we measuring how many permits were issued, and how many permits were requested, and how many permits were declined… when all we wanted to know is if people are finding it easy to apply for a permit? Why don’t we just ask them in a survey after they’ve applied for their permit, what their experience was?”) We all want local governments to be able to avoid that often-leveled criticism of being inefficient and impractical.
Keep it tight. Staying focused helps strike a balance between metrics, the team’s capacity to analyze and use them, and the practicality of data collection.
As one of our favorite local government leaders likes to say “focus on the The Vital Few: those key performance measures that will actually tell you how the organization is performing.”
Step 4: Communicate and Collaborate around your Performance Measures
The Government Finance Officers Association (GFOA) stresses the importance of communicating with clarity and transparency in the process of developing KPIs and measuring performance. Governments should be able to clearly articulate why they’re trying to measure something. Incorporating feedback from the community and engaging with local government staff during the KPI selection process will likely go a long way in bolstering results. A collaborative approach ensures that KPIs reflect a comprehensive understanding of the community’s needs and the government’s capabilities.
Step 6: Consistently Monitor, Review, and Take Action on Key Performance Measures
Once your key performance measures are chosen and implemented, set up a monitoring and review process. A tool like Envisio—which is made to help measure performance, deliver strategic plans, and help with progress reporting all in one place—can help with this process. Regularly track and analyze the data collected, and compare it against established targets. If any KPIs consistently fall short of targets, it’s essential to identify the root causes and take corrective actions to address the issues effectively.
Now, without further ado, let’s look at some of the top local government key performance measures for a modern approach to measuring municipal government performance.
50 Modern Municipal Government Performance Measurement Ideas
Resident Satisfaction and Engagement
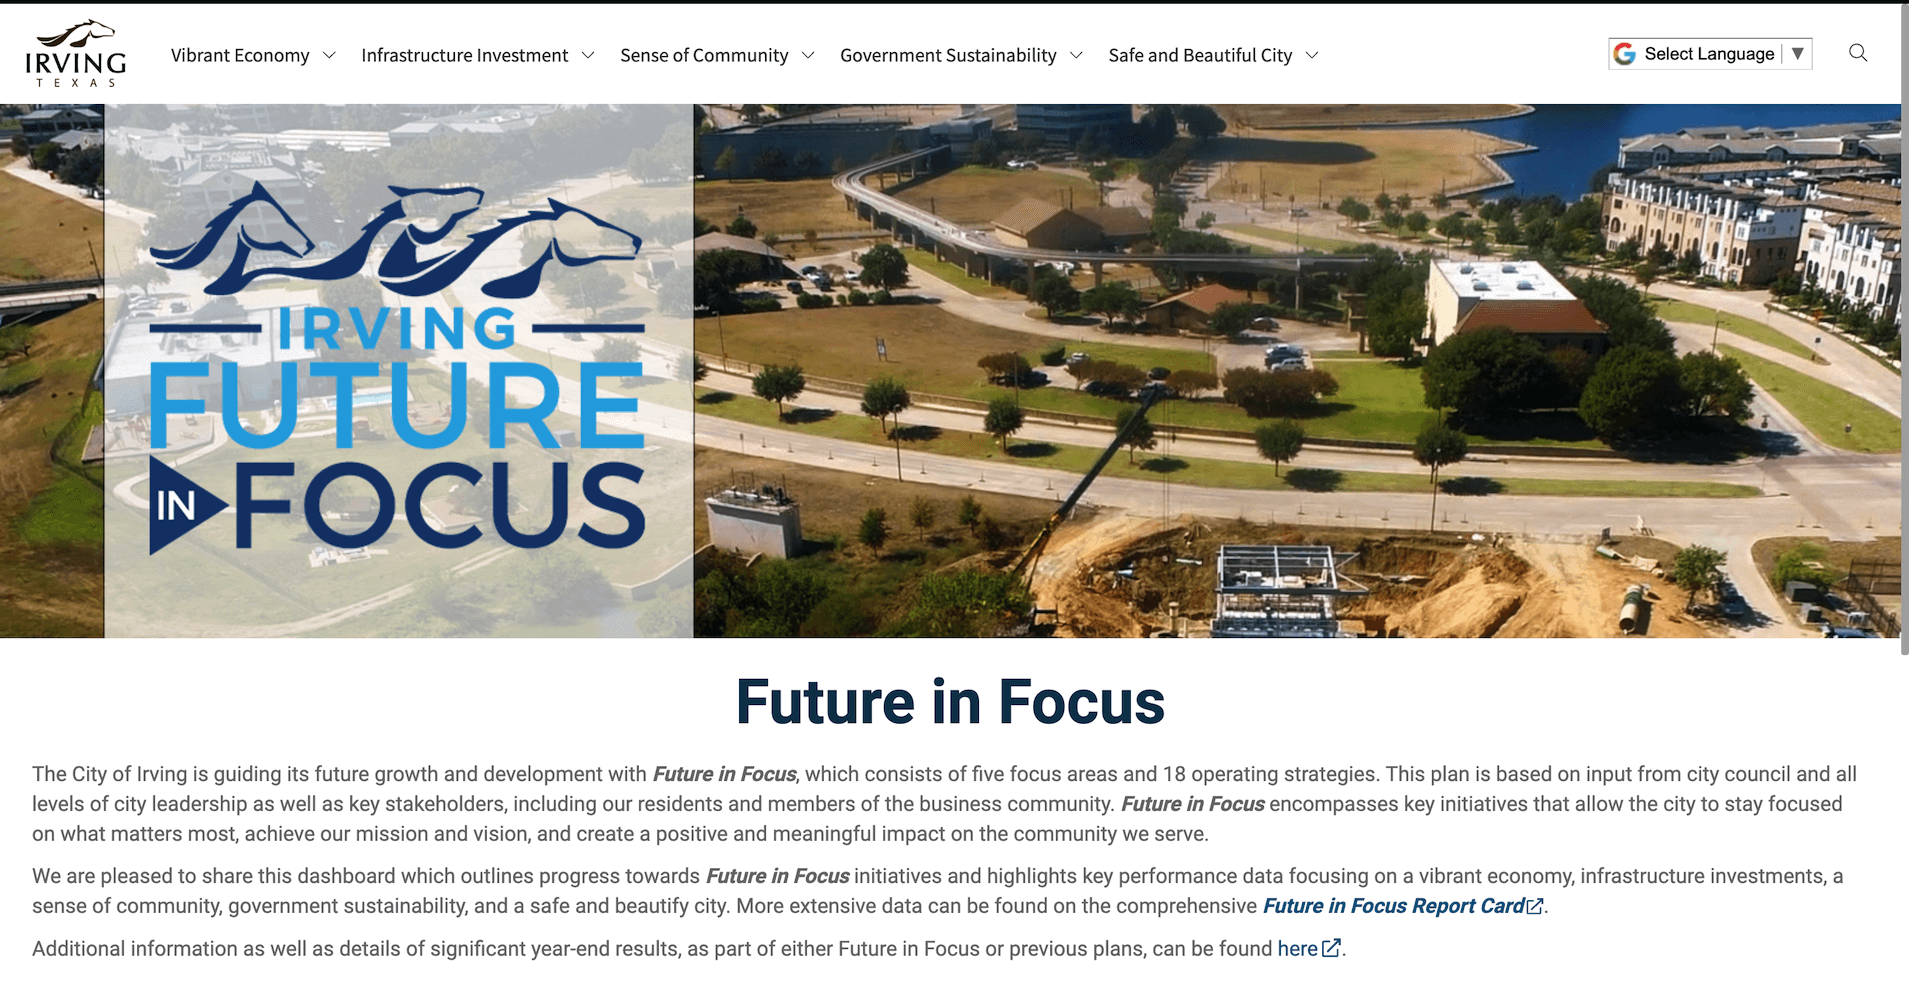
1. Resident Satisfaction Index – Measure overall satisfaction levels of residents with local government services. Take a look at the City of Irving, TX, and how they measure resident satisfaction in every pillar–from sense of community to sense of satisfaction with infrastructure–on their Future in Focus dashboard!
2. Service Response Time – Track the time taken to respond to resident inquiries and service requests. Keep it simple: if a resident inquiry or request consistently takes a long time (or starts to increase), that’s actually great information to have!
3. System Usability Scale – Evaluate your local government’s communication of bureaucratic processes by soliciting community feedback on how usable, or easily accessed, particular features are. How long does it take to do something? Is there a process that can be digitized that hasn’t yet been digitized?
4. Community Events Attendance – How many folks showed up? Who showed up? These are metrics that can be used to improve future events.
5. Social Media Engagement – Tracking the level of engagement on social media platforms can be a great way to see whether or not your city’s plans are getting the kind of buzz you want! Tracking who engages, what they engage with, and how often your content is shared, is a great KPI for indicating interest and engagement levels.
(Sidenote: We recognize the importance of not conflating resident engagement with resident satisfaction. More on that in the Community Trust section below!)
Community Trust
Trust is a difficult concept to measure (once described to me as a “squishy” concept, which I love). Despite its squishiness, local government organizations should be able to consistently measure community trust over time through a set of proxy measures.
Through extensive research with academic and private sector partners, and incorporating local government practitioner input, we identified some common constructs of trust. The next set of suggested municipal measures are all measured through resident surveys.
To learn more about measuring trust in local government, and our work in this area, please get in touch!
1. Overall Trust – Using a survey question such as “How much do you trust the city?” with a scale (ideally a 5-point scale) of available answers and an optional free-form text area for a short explanation of the answer given can be a useful way to get a baseline measure of trust. Survey respondents will likely use the open-ended space to air grievances or speak about specific events, but these are all part of the process of learning to listen and measure trust with your residents.
2. Competence – Ask residents how they would rate the quality of services provided by the city; again, using a 5-point scale. Low levels of perceived competence generally indicate low levels of trust in the ability of the city to carry out their plans, or low levels of trust in the city being able to handle challenging situations or crises.
3. Openness and Inclusion – This is a measure of the perception of how well, or how much, the city includes residents in its decisions. Ask “How much is the City willing to show you behind-the-scenes?” Municipal governments that want to score well in this area should be fostering two-way communication with stakeholders, where relevant and usable information is provided, and interaction is fostered as a means to improve transparency, accountability, and engagement.
4. Reliability – Ask “How much can you rely on the City to do what it says?” The reliability construct of trust addresses the ability of the local government to minimize uncertainty in the economic, social and political environment of their residents, and to act in a consistent and predictable manner.
5. Helpfulness – Ask “How useful and helpful is the information that you receive from the city?” This is a measure of the perception of how effectively the city or county is keeping residents informed about issues facing the community.
Financial Performance
1. Budget Execution Rate – This refers to the amount of the original budget implemented. How much was actually spent? Measuring the rate of budget execution is a good tool for problem solving; by regularly checking to see if the budget is actually being spent in any given area, you can prevent problems like uneven implementation. Benchmarking can really help with this (what’s your budget execution rate compared to municipalities that you aspire to be more like? Or those that are similar to you?)
2. Input to Output Ratio Measurement – Simply put, dividing the output by the input. Referred to as I-O in macroeconomics, this is a classic efficiency and productivity measure; how much is going in, and how much is coming out? This is a key step in outcomes-based budgeting.
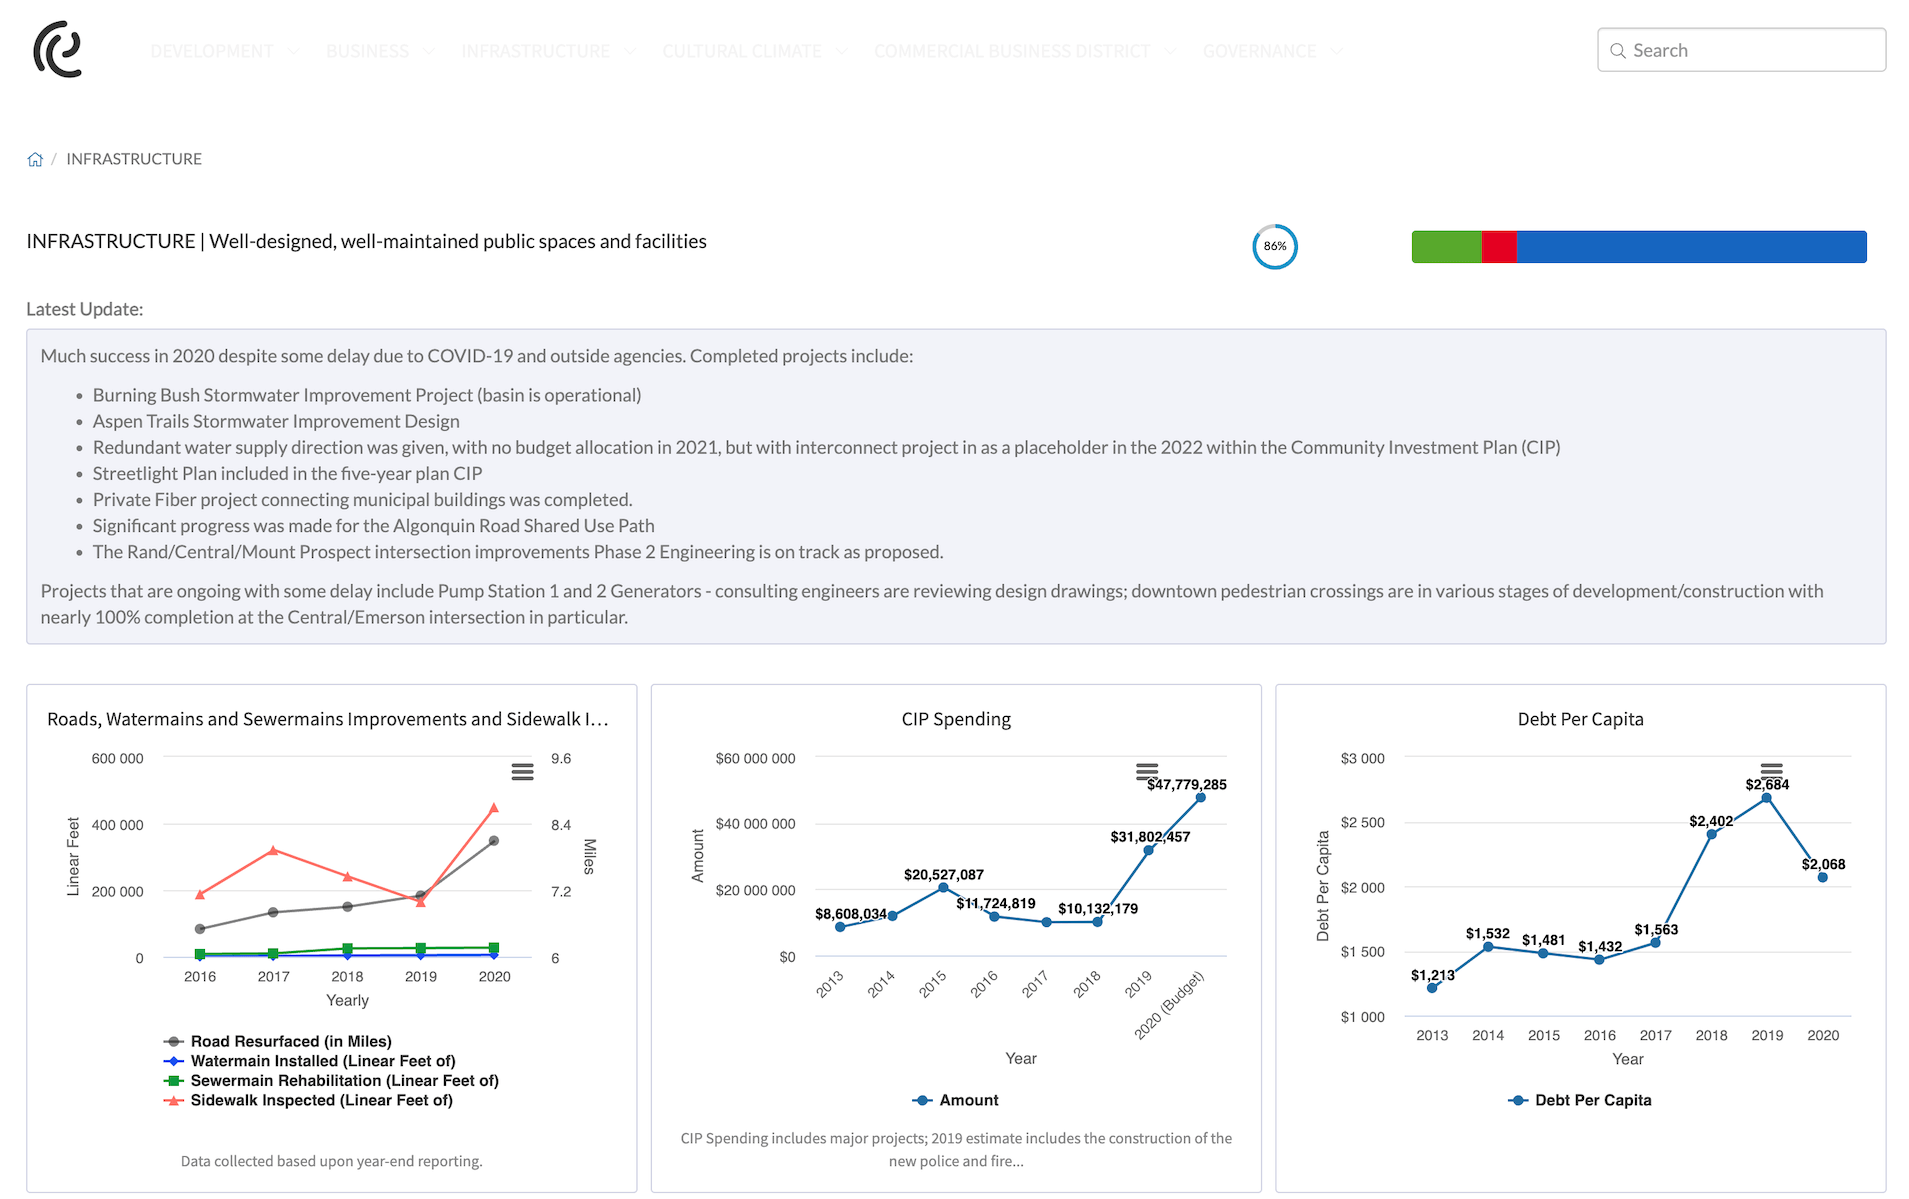
3. Debt per Capita – Debt in government is a tricky thing. Often blasted as a thing to avoid at all costs, utilizing municipal debt can actually be a valuable strategy in accomplishing plans. It’s important to measure things like bond to debt ratio, and benchmark your debt relative to other local governments. Have a look at the Village of Mount Prospect’s public dashboard to see how they chart this particular performance measure:
4. Increases in Taxable Value per Dollar – Measuring the shifts and changes over time in how much value is generated through each taxable dollar.
5. Grants and Funding Acquisition – This measures the success rate of obtaining grants and external funding. This can help you determine how much time is worth spending on trying to snag those grants in the first place.
Public Safety and Security
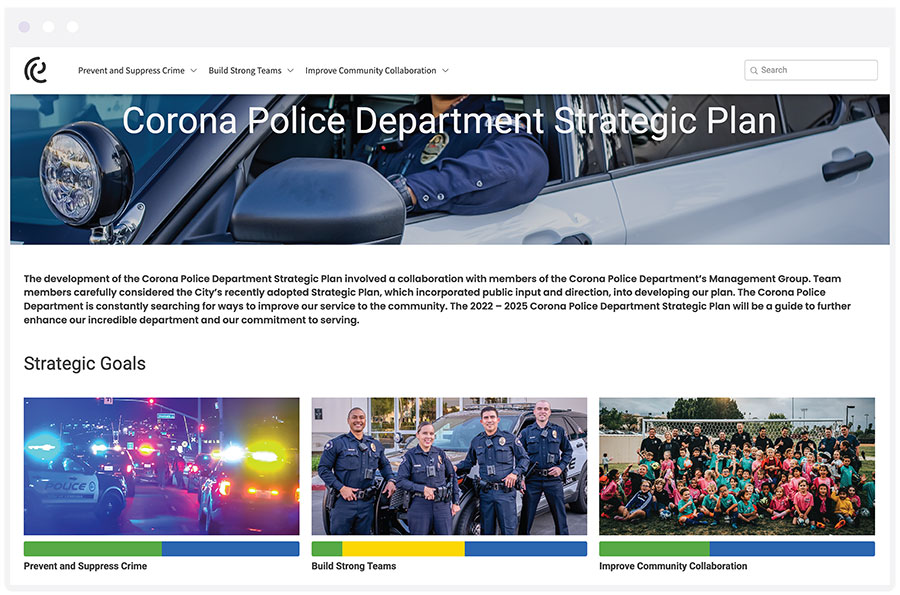
1. Crime Rate – A commonly used municipal performance measure is the number of reported crimes per capita. It is important, however, to split out the types of crime being reported (violent crime versus property-based crime), and canvas a wide area to avoid negative bias disproportionately impacting areas with higher-rates of poverty. For instance, areas with high rates of poverty are likely to result in higher rates of desperation, inequality, and will therefore have higher rates of needs-based crimes. The City of Corona’s Police Department focuses on preventing and suppressing crime as one of their Strategic Goals.
2. Emergency Response Time – Evaluate the efficiency of emergency services in responding to crises. Check out our piece on fire department performance measures, as part of our Measure what Matters series, for more.
3. Cybersecurity Preparedness – A preventative measure that assesses the level of preparedness against cyber threats and attacks: this can be assessed internally, through measurements such as number of hardware updates. One of our customers, Clayton County, measures the modernization of their software and hardware as a means of tracking their cybersecurity.
4. Traffic Accident Rate – Monitor the number of traffic accidents per capita.
5. Feelings of Safety – You can engage your community in a collaborative process and solicit ongoing feedback on how they feel about the public safety services provided in your community.
Infrastructure and Public Works
1. Number of Preventative Maintenance Projects – All infrastructure gets a lot of wear and tear on its use over the years, and data-driven infrastructure maintenance is a game changer. Local governments may choose to do preventative maintenance – either by routinely maintaining something on a set schedule, or maintaining something if certain conditions are met (“It was a particularly rainy season, and we know this road had small potholes already, so let’s repair them now.”)
2. Green Initiatives Adoption – Monitor the implementation of environmentally friendly policies and programs. Have a look at The City of Montpelier’s dashboard for more inspiration on this. They are measuring their performance carefully towards their goal of becoming the first State-capital city to achieve carbon neutrality.
3. Parks and Recreational Facilities Satisfaction – Evaluate resident satisfaction with local parks and recreational facilities through a survey, or through an analysis of how often these services are being used.
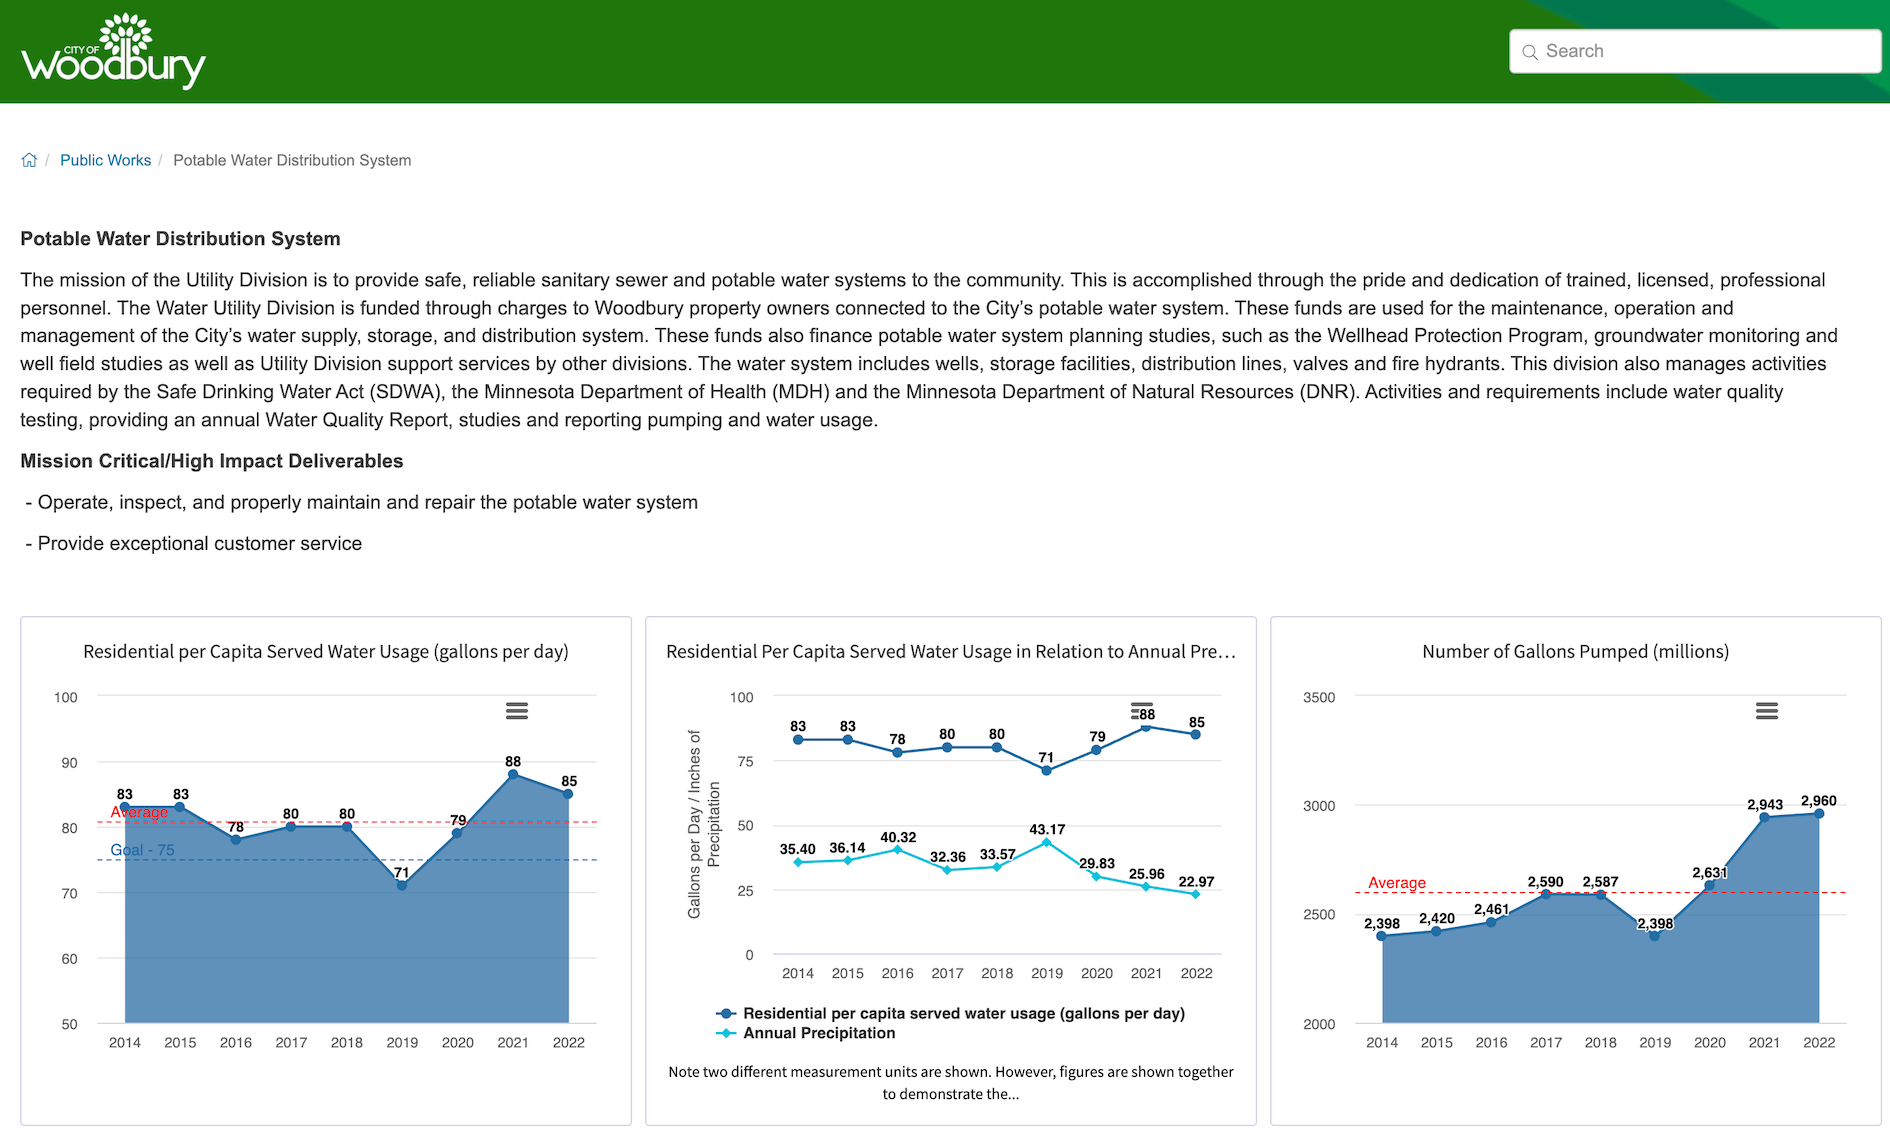
4. Water Usage: This can be measured either as gallons of drinking water produced daily, or by residential water usage; City of Woodbury’s “Residential per Capita Served Water Usage (gallons per day)” chart can be seen below, tracking data from 2014 to 2022.
5. Energy Consumption Reduction – Track efforts to reduce overall energy consumption. One place to start is in buildings already owned and used by the city; measuring a tangible energy reduction in government buildings will help iron out any kinks before you start measuring this across your city.
Community Development
1. Graduation Rate – Track the percentage of students graduating from local educational institutions.
2. Poverty Rate/Supplemental Poverty Measure – Statistics on poverty are usually deflated. Many statisticians and advocates argue that only measuring by the poverty line doesn’t adequately capture data on the number of people living very close to the brink of total financial destitution; it’s best to track both “official” poverty rates, and Supplemental Poverty Measures. Tracking the number of people living in poverty will be a major leading indicator of a number of overlapping elements, including (but not limited to), literacy, graduation rates, poor health, and unemployment rates.
3. Childcare Services Availability – Measure the availability of childcare services for local families. One way to determine this is to see how close the most affordable childcare service is.
4. Cultural Diversity Index – Evaluate the level of cultural diversity within the community–one method could be starting by counting how many cultural institutions are available to members of different communities, and then systematically surveying those institutions (separate surveys for attendees and leadership) on how satisfied they are with those services. Another way is to survey all neighborhoods generally, and ask if they feel comfortable identifying their background, and if they feel their culturally specific needs are met or able to be expressed in their community.
5. Number of Accessible Housing Options – Increasing low-cost and accessible housing that promotes community is a metric that you’ll want if you intend to measure either long-term or short-term moves towards promoting aging in place, or ensuring people with disabilities can still thrive and participate in their communities.
Public Health Performance Measures
1. Health Insurance Coverage – This KPI measures the percentage of the resident population covered by health insurance.
2. Individuals Experiencing Homelessness – Tracking your local government’s current tactics towards those suffering homelessness is a key component in responding compassionately and effectively. Benchmarking can be especially useful in this practice.
3. Public Health Program Participation – How many residents participated or attended public health programs and initiatives? How many public health programs were held?
4. Number of Immunization Clinics – Combatting vaccine disinformation involves a public health department that is mobilized and able to be integrated into the community. Checking how many immunization clinics are being used can help public health officials get a clearer idea of what’s needed to ensure accessibility.
5. Mental Health Support Availability – Assess the accessibility of mental health services for residents.
Education and Culture
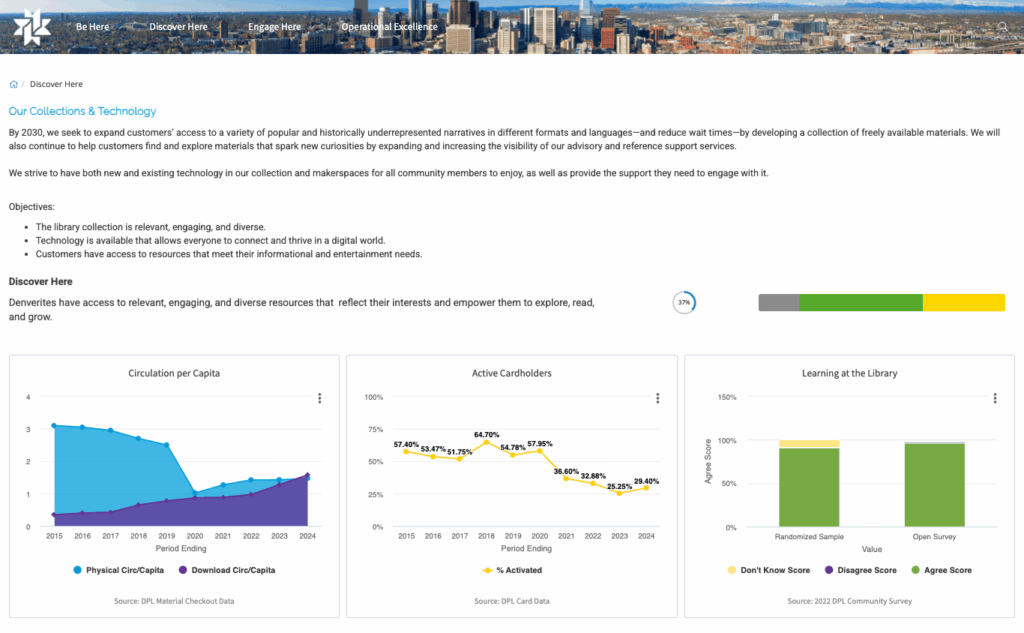
1. Public Library Usage – Measures the number of visitors and resources borrowed from public libraries. Denver Public Library measures things such as number of circulation per capita and active cardholders!
Check out our piece on library performance measures as part of our Measure What Matters series for more examples of commonly used public library performance measures!
2. Arts and Culture Events Attendance – Measure resident attendance and participation in cultural events and festivals. An additional metric to measure is the demographic of residents participating in which activities: how many people attend free events vs paid events? Are the events held often at night or in the morning? These questions can help your municipality curate cultural programming in your community for people with children, access needs, and varying income levels.
3. Number of Educational Opportunities for Language Minorities – Monitor the number of non-English speaking educational programs and workshops.
4. STEM Education Support – Track support and initiatives for science, technology, engineering, and mathematics education.
5. Arts and Culture Program Funding – Arts and culture tends to be supported by a combination of private donorship and funding. Tracking the amount that comes in, and from where, will help you refine your granting “ask” when it comes time to reapply. In sum – measure the funding allocated to support arts and cultural programs, including diverse or minority arts programs.
Economic Development
1. Unemployment Rate – Number of people in a community who are unemployed. Another good metric for this is measuring how many residents are part-time workers, or precariously employed. The type of employment opportunities available to residents is an important indicator of economic health in a community.
2. Jobs Created — Measure the rate of new job opportunities being created.
3. Business Vacancy Rate — Number of businesses that opened or closed during a fiscal year.
4. Business License Issuance – Measuring how many licenses are issued, or how long it takes to get one, might help you see obstacles to young business owners. This information can help you diversify your city’s economic portfolio. Simply track the time taken to issue business licenses.
5. Number of Entertainment and Restaurant Businesses – Tourism activity and availability of local entertainment options provides useful indicators of the economic well-being of a community. Measuring the development – or loss – of these spaces is an important metric for ensuring longevity of a community.
—
These are some of the most important, and increasingly common, local government KPIs and municipal government performance measures. By tracking these, municipalities can focus on areas that matter the most for their communities—and improve where necessary!
Tracking these metrics regularly empowers local governments to identify strengths, address weaknesses, and work towards creating a better and more sustainable future for their residents.
Each of these metrics plays a vital role in ensuring the effective functioning and prosperity of the community, leading to a happier, healthier, and more humane society.
Get the Guide ↓
Get more municipal performance measurement examples and a complete step-by-step guide to creating effective local government performance measures with our guide on How to Develop Local Government Performance Measures. This, our most popular guide, helps you to determine what you should measure and how you should measure it.

