Contents
Summary
Higher education institutions operate in complex, fast-moving environments where accountability, equity, and student success must all be measured and reported with clarity.
Drawing from real-world examples, below we take a closer look at 10 of the most common university KPIs, ranging from enrollment and retention to diversity, student satisfaction, research funding, and facilities utilization, and explore how institutions are using these metrics to guide strategic planning, inform decision-making, and communicate progress transparently.
Welcome to Measure What Matters, where we focus on performance measurement across the public sector. We love talking about SMART goals and Key Performance Indicators (KPIs), and public sector organizations that measure what matters.
In previous posts, we have done deep dives into the most common police department performance measures, library performance measures, and others.
Today, we’re turning our attention to higher education, with a closer look at higher education and university KPIs.
Higher education institutions are dynamic spaces of learning and change. Some of the reasons universities may track particular indicators are to enhance internal accountability, foster greater campus and employee diversity, gauge student satisfaction, and get a sense of enrollment trends, workforce demographics, and student completion rates. These essential measures help shape an educational experience. Staying on top of these university KPIs keep higher education institutions relevant, proactive, and innovative.
We are fortunate enough to work with some of the highest performing higher education institutions in North America to support them in executing plans, measuring performance, and communicating results.
Drawing insights from our extensive database and real-world examples from esteemed institutions such as Catawba College, Northeast Ohio Medical University (NEOMED), Gallaudet University, Green River College, and Kennesaw State University, let’s dive into some of the key metrics that drive success in the higher education landscape.
Whether you’re a university administrator seeking to refine your performance management strategies, or an enthusiast eager to understand the metrics behind higher education success, these example KPIs in higher education should provide some inspiration!
Unlocking success: 10 popular university KPIs explored
Good strategic planning with strong performance measurement habits, combined with transparent reporting, helps higher education institutions better serve their students, employees, alumni, and the local communities they support. Tracking key organizational metrics enables universities to make data-driven decisions, ultimately delivering more efficient and effective services.
But what do universities measure?
We did a deep dive into some of the most recent think pieces around the best higher education data practices, management, and measurement systems, and compiled a list of 10 popular higher education KPIs and performance metrics.
- Student enrollment: Tracking the total number of students enrolled, year over year, provides insights into the overall size and growth trends of the student body,which can be used to influence resource allocation and strategic planning.
- Student retention rate: Monitoring the percentage of students who continue their studies from one academic year to the next helps assess the effectiveness of academic programs, student support services, and campus engagement initiatives.
- Graduation rate: This KPI measures the percentage of students who successfully complete their degree programs within a specified timeframe.
- Student satisfaction surveys: Student surveys can help gauge trickier concepts, such as students’ “sense of belonging”. Measuring student satisfaction through surveys can help assess critical components of a university’s success, such as teaching quality, campus facilities, support services, and overall institutional climate.
- Employment rate of graduates: Tracking the percentage of graduates who secure employment within a certain period after graduation indicates the effectiveness of academic programs in preparing students for the workforce.
- Faculty-to-Student ratio: This university KPI evaluates the balance between faculty resources and student enrollment, influencing class sizes, teaching quality, and faculty workload management.
- Research funding: Measuring the amount of funding secured for research activities reflects the institution’s commitment to scholarly pursuits, innovation, and academic excellence.
- EDI/Diversity metrics:Understanding the diversity of the student body, faculty, and staff can be used to promote inclusivity, cultural competence, and equitable representation within the university community.
- Retention and tenure rates for faculty: Monitoring the retention and tenure rates of faculty members reflects job satisfaction, professional development opportunities, and institutional support for academic staff.
- Facilities utilization: Evaluating the utilization of campus facilities and resources can be used to help optimize space management, infrastructure investments, and campus planning initiatives.Below, we’ll look at the most commonly used university performance KPIs from our database and provide examples as to how higher education institutions are actually measuring and reporting on them. All of these metrics can be found on Envisio-powered public dashboards published by these institutions. We hope you find these valuable in developing your own performance measures!
University KPI: Enrollment Year over Year
Monitoring the total number of students enrolled per academic year is crucial for universities.
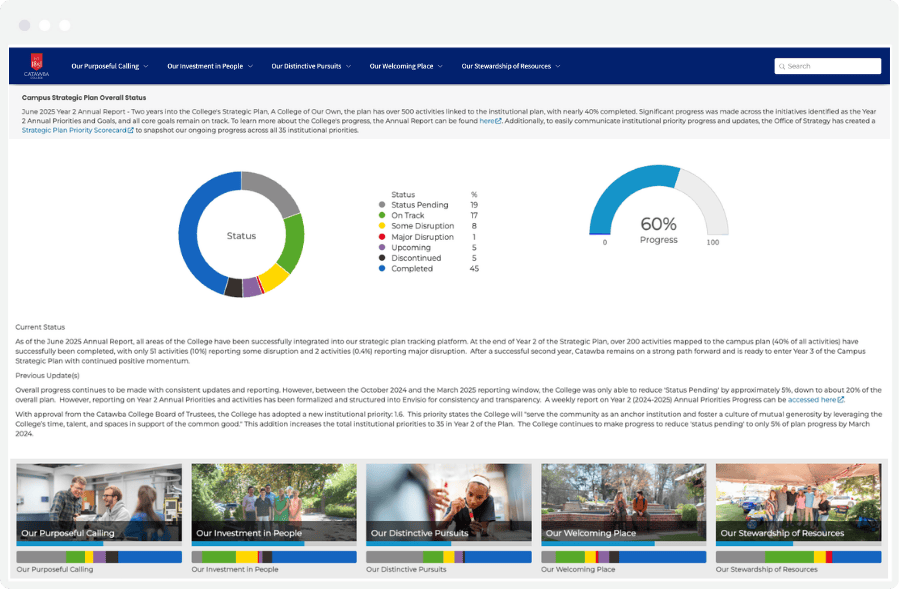
Catawba College, NC, is in the early process of tracking enrollment trends on their Strategic Plan dashboard through a number of their strategic initiatives. We can find information related to their enrollment goals under two of their strategic pillars: “Our Purposeful Calling,” and “Our Welcoming Place”. Both of these pillars are dedicated to action items related to tracking and increasing enrollment.
Their strategic plan provides a detailed breakdown of their priorities, which include various enrollment tactics and KPIs. They are hoping to increase the percentage of out-of-state enrollment by 40% by 2027, and increase overall undergraduate enrollment by 30% by 2028. Their strategies include ensuring they are pulling from diverse communities, and implementing a “living-learning laboratory facility” in the campus master plan.
University KPI: Equity and diversity metrics
Measuring equity and diversity metrics in university KPIs is essential for fostering an inclusive and equitable learning environment. By tracking indicators such as gender, race/ethnicity, socioeconomic status, and other demographic factors, universities can assess the representation and experiences of diverse student populations, faculty, and staff.
Understanding these metrics allows institutions to identify disparities in access, retention, and academic outcomes, guiding targeted interventions to address systemic barriers and promote equity. Monitoring diversity metrics demonstrates moral and cultural competence, which bolsters a university’s reputation and also fosters a sense of belonging among members of the university community.
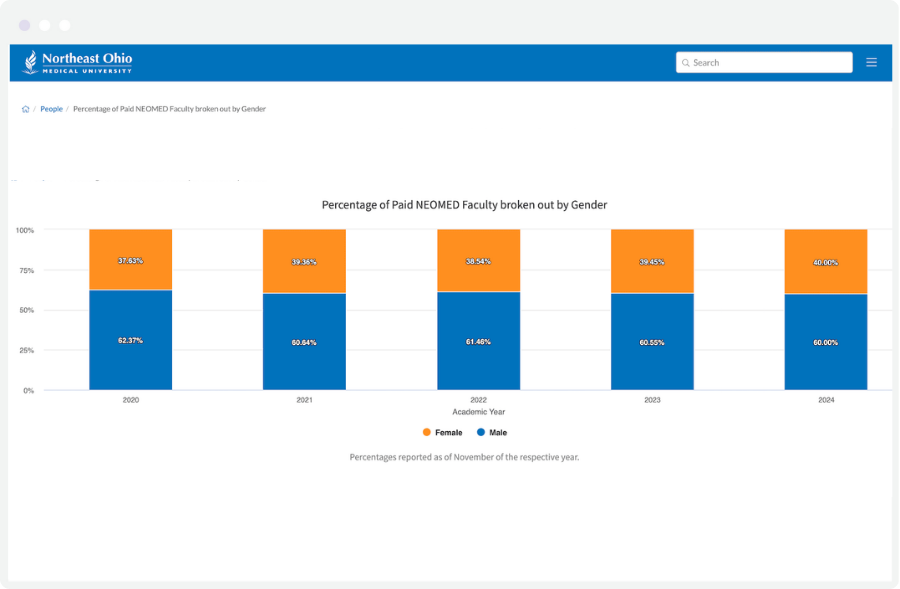
Performance metrics around gender
This entails comparing the proportion of male and female employees, typically categorized by staff and faculty roles, and measured on an annual basis.
Northeast Ohio Medical University (NEOMED) exemplifies this practice through its Strategic Plan: Creating Transformational Leaders dashboard. NEOMED diligently tracks the gender demographics of its staff and faculty, aligning with its guiding principle of fostering a diverse workforce and student body. They are one of our most meticulous data-driven heroes; take a peek at their dashboard, and you’ll see why:
Northeast Ohio Medical University (NEOMED) does exactly this. As part of their Strategic Plan: Creating Transformational Leaders Dashboard they track gender demographics of staff and faculty in line with their guiding principle of being “committed to attracting and retaining a diverse workforce and student body. [NEOMED] is committed to ensuring equity and inclusion at all levels of the University.”
Performance metrics around racial equity
Similarly to above, tracking the racial and ethnic composition of staff and faculty is vital for promoting diversity and representation. Gallaudet University, the world-leading university for deaf and hard of hearing individuals, Gallaudet University utilizes American Sign Language (ASL) and English to foster growth and advancement. They are also committed to anti-racism as a strategic organizational pillar.Their progress towards removing long-standing systemic barriers around racial equity is measured by establishing university-wide collaborations and charters – for instance, they are currently working on implementing an anti-racism policy.
Forward looking equity KPIs around financial background
Another excellent example of equity KPIs in higher education is from Green River College and their Equity-Centered Strategic Plan dashboard.
By 2026, Green River College aims to enhance student success through a robust onboarding process, ensuring that all students—and in particular, students from a lower income and/or racialized background–have personalized educational, financial, and career transition plans by their second quarter of enrollment.
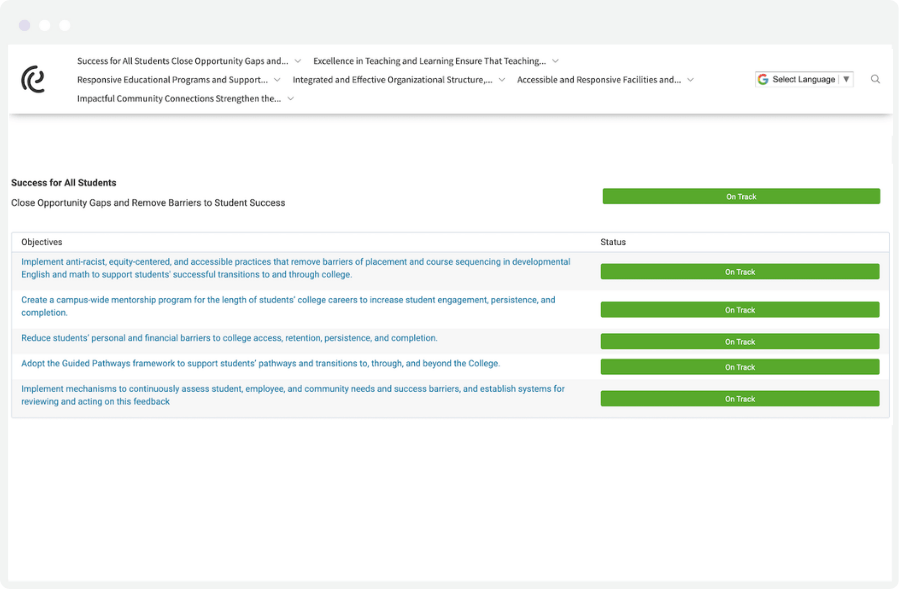
Furthermore, through their “Success for All Students” strategic pillar, Green River College is committed to closing opportunity gaps in retention, progression, and completion rates among students. The goal is to elevate the student completion rate from 38% to 43% by 2026, striving for minimal or no opportunity gaps to ensure equitable outcomes for all students.
University KPI: Student satisfaction
Gauging student satisfaction is paramount for evaluating the quality of the educational experience. NEOMED university is in the process of gathering data around their student experiences, so they can define and strategically operationalize improvements.
Universities that regularly conduct student surveys to measure satisfaction levels are better positioned to improve the overall elements of campus life—such as overall respectfulness, and program satisfaction. You can take a cue from NEOMED, and conduct these surveys around various services offered, such as student satisfaction with the campus Writing Center.
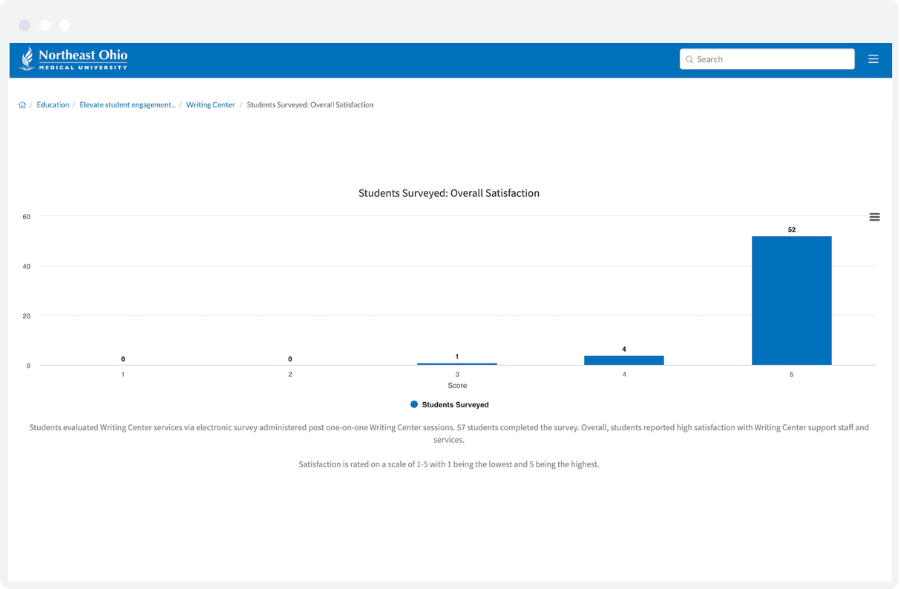
Overall student satisfaction is typically measured by student surveys, usually annually and/or per semester.
Other student survey-based measures we found in our database included survey ratings on topics such as “welcoming environment” (the percentage of students, faculty and staff who feel welcomed at the university or college), “treated with respect”, and “student belonging”.
University KPI: Student retention/graduation rate
Tracking the percentage of students who successfully graduate is a key measure of educational outcomes. Kennesaw State University is going after their goal of becoming an R2 research university. Through their strategic plan and roadmap, they are aiming to enhance community and culture, improve undergraduate educational experiences, grow graduate programs and enrollment, and promote interdisciplinary research.
Some of their KPIs include attaining a first-year retention rate of 82% by 2025, and achieving a six-year graduation rate of 60% by 2028.
—
Monitoring KPIs and establishing meaningful data for performance measures is integral to the strategic success of universities.
By focusing on initiatives such as increasing out-of-state enrollment, promoting gender and racial equity, and addressing opportunity gaps based on financial background, these universities are actively working towards fostering diverse and equitable learning environments.
Efforts to gauge student satisfaction and improve retention and graduation rates are crucial for enhancing the overall educational experience and outcomes.
Through diligent tracking of KPIs and implementation of targeted action items, higher education institutions can effectively address challenges, capitalize on opportunities, and ultimately, fulfill their missions of providing high-quality education and fostering student success.
Get the Guide ↓
Download our guide on developing performance measures or request a demo to discover how Envisio supports universities in building, tracking, and reporting their performance effectively.